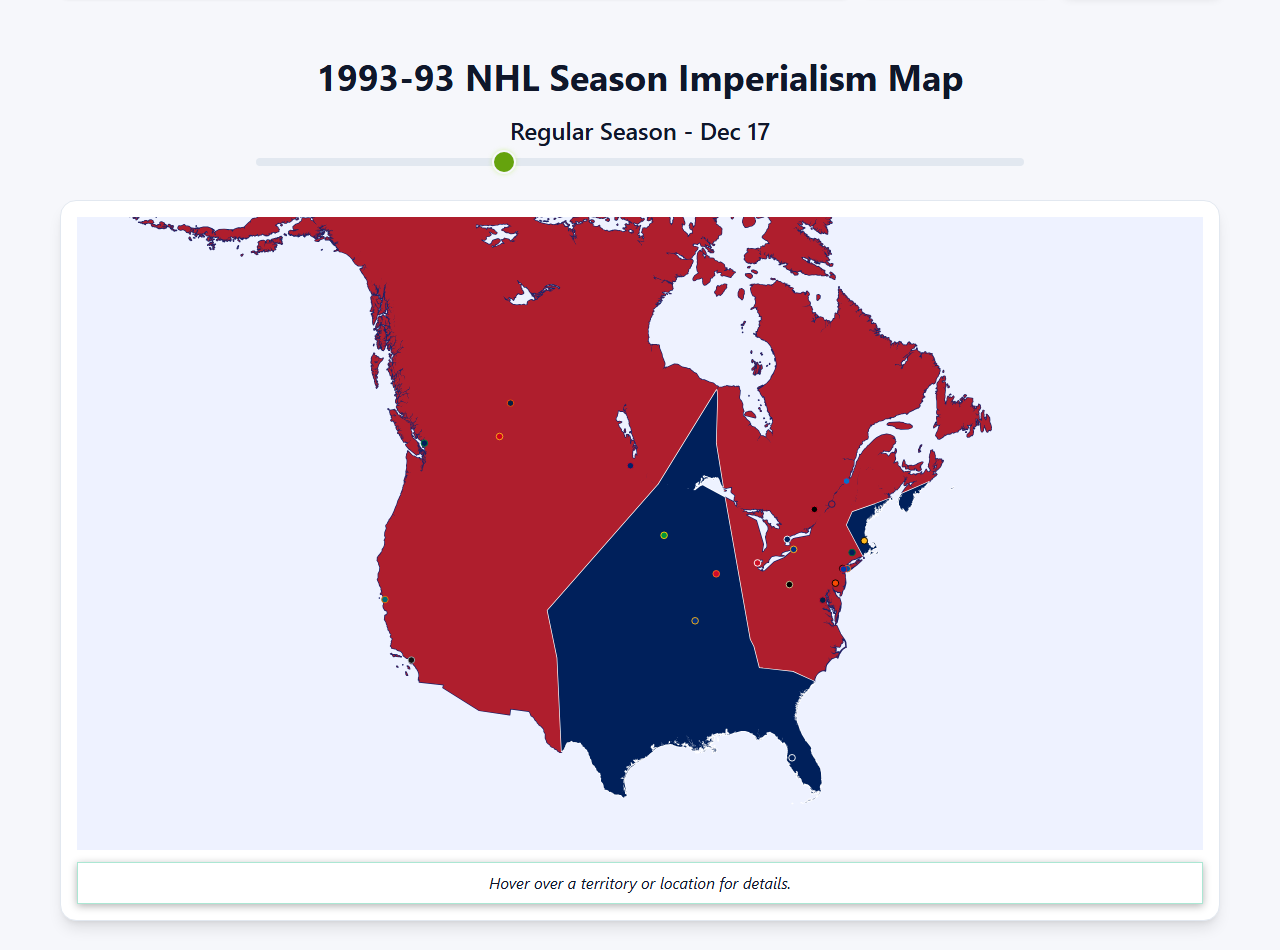
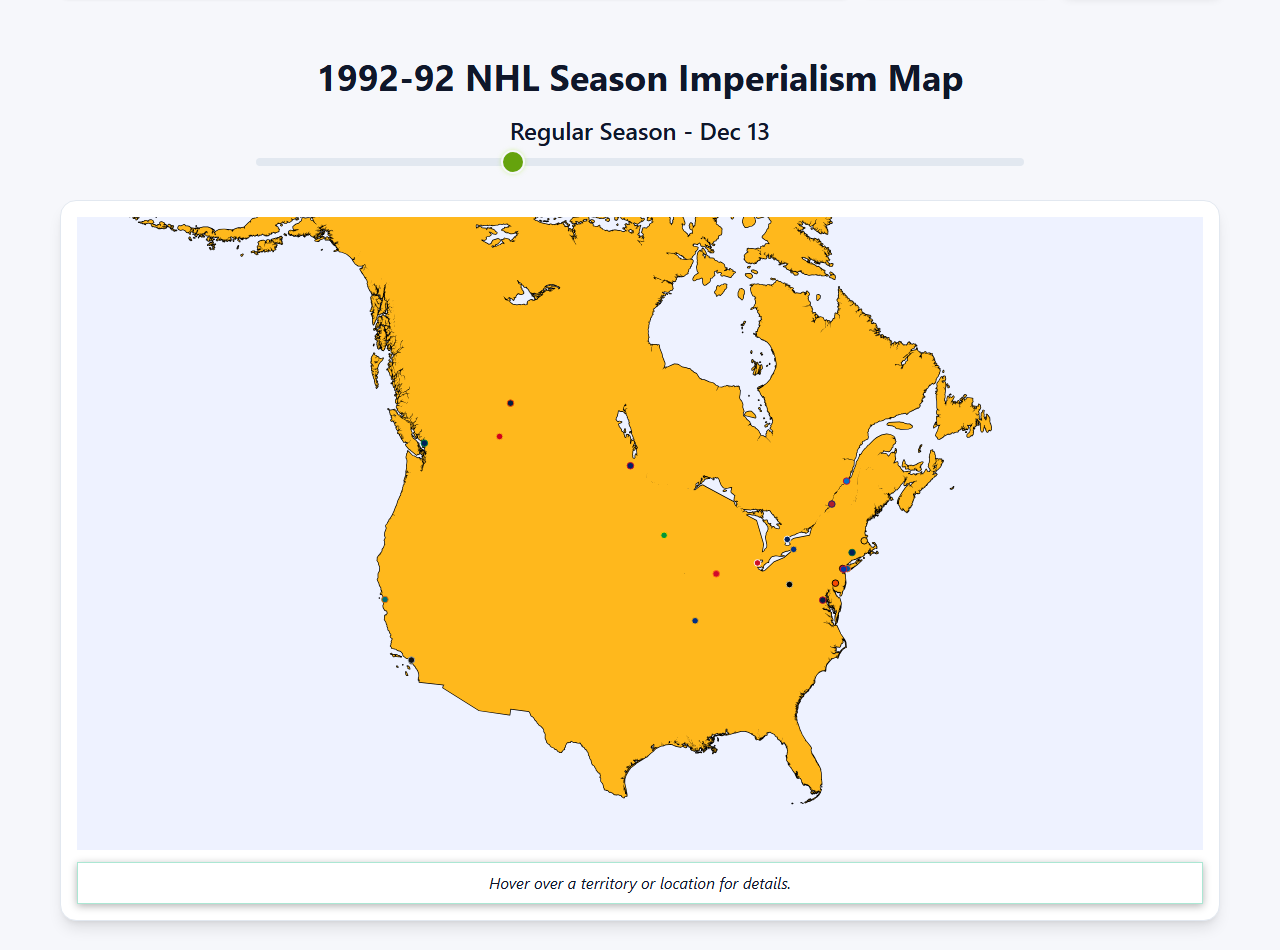
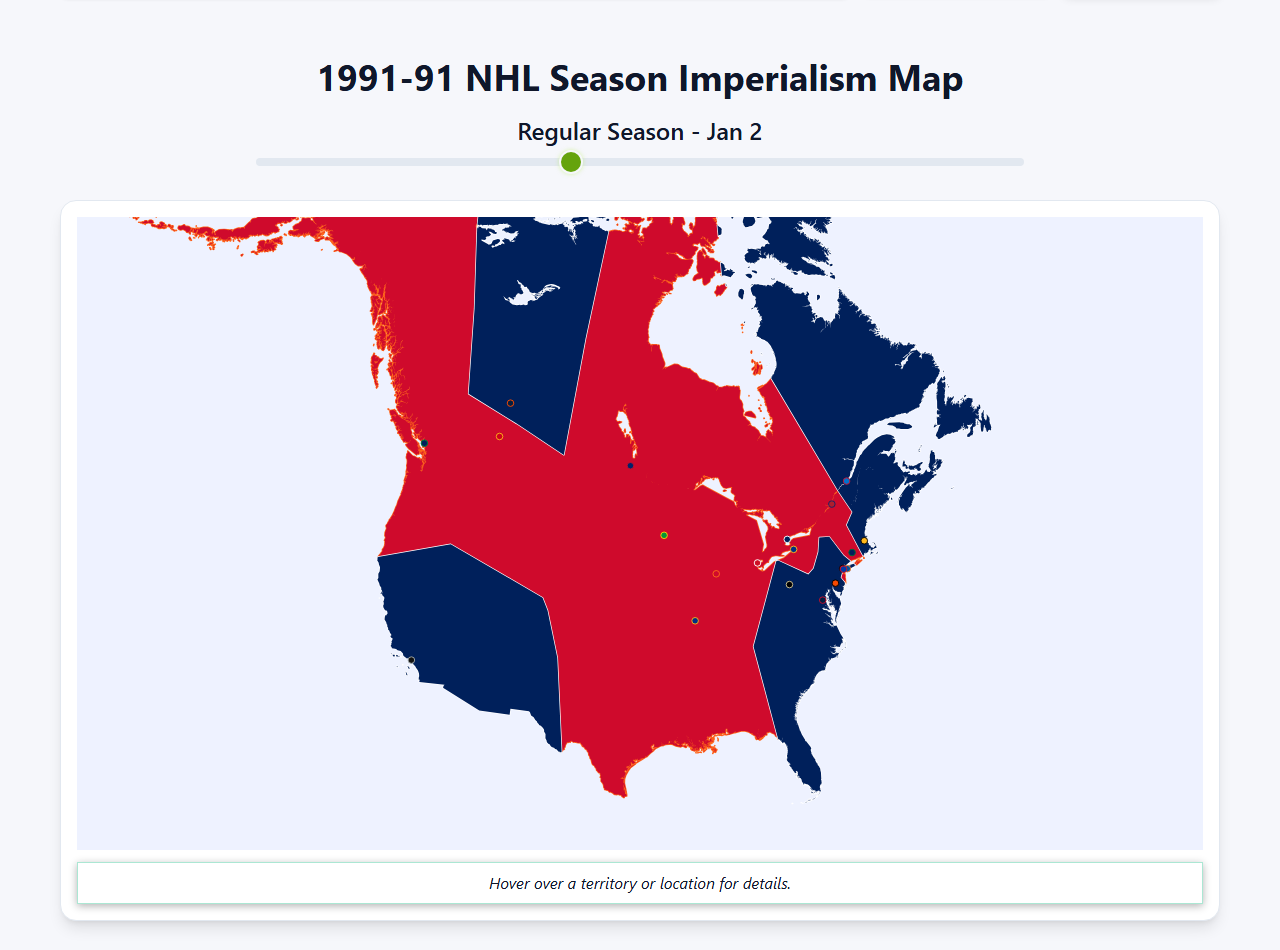
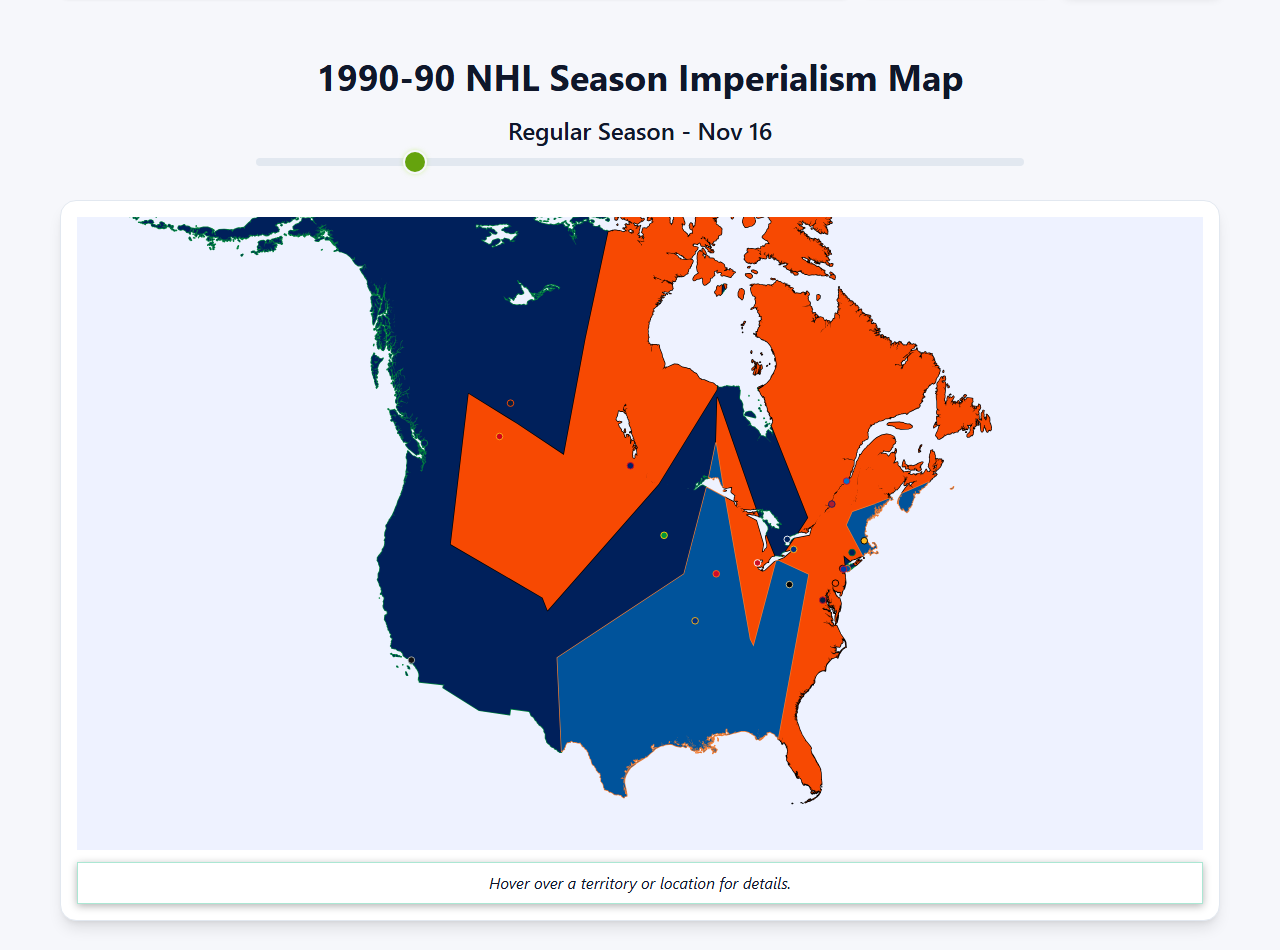
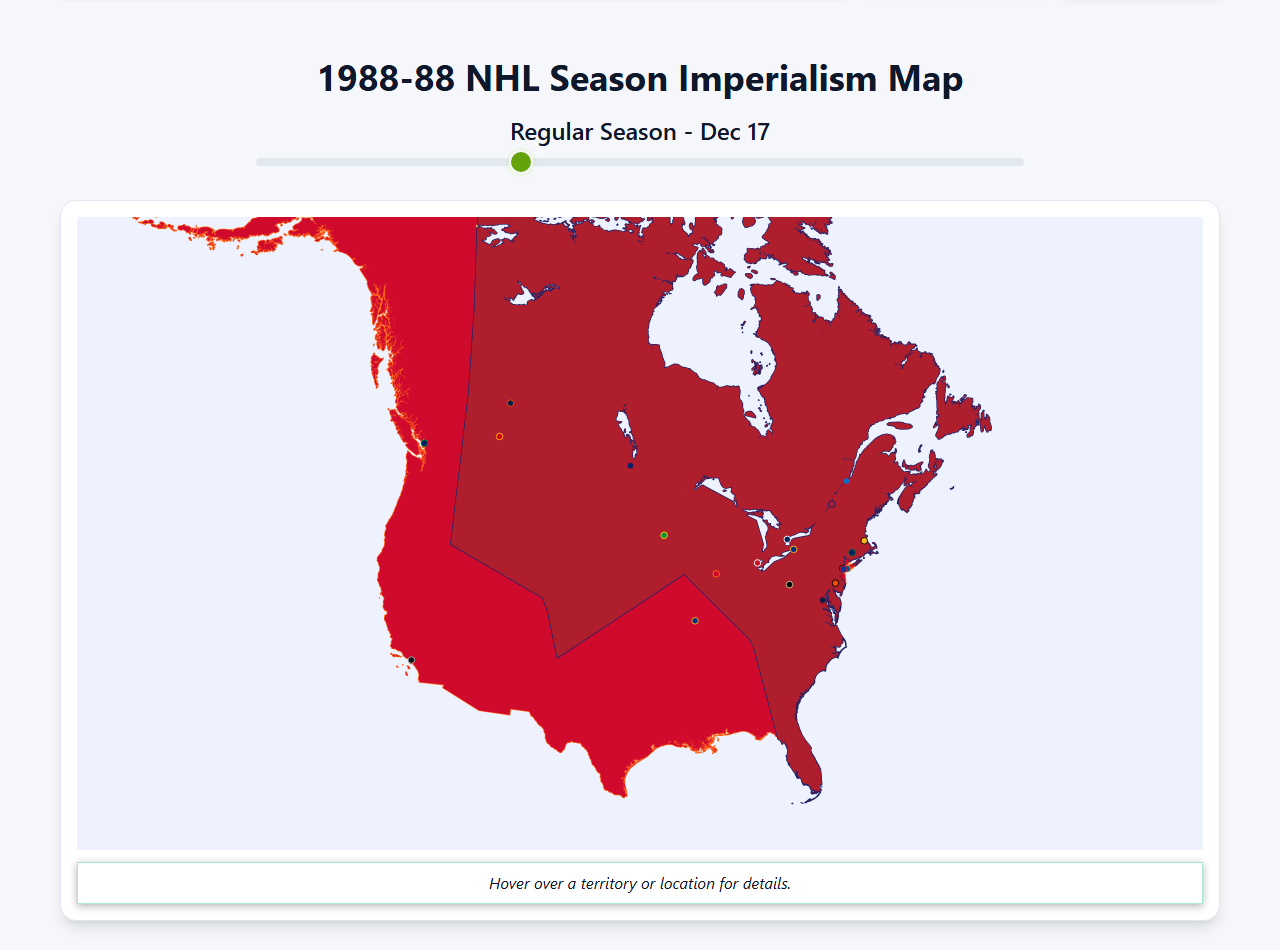
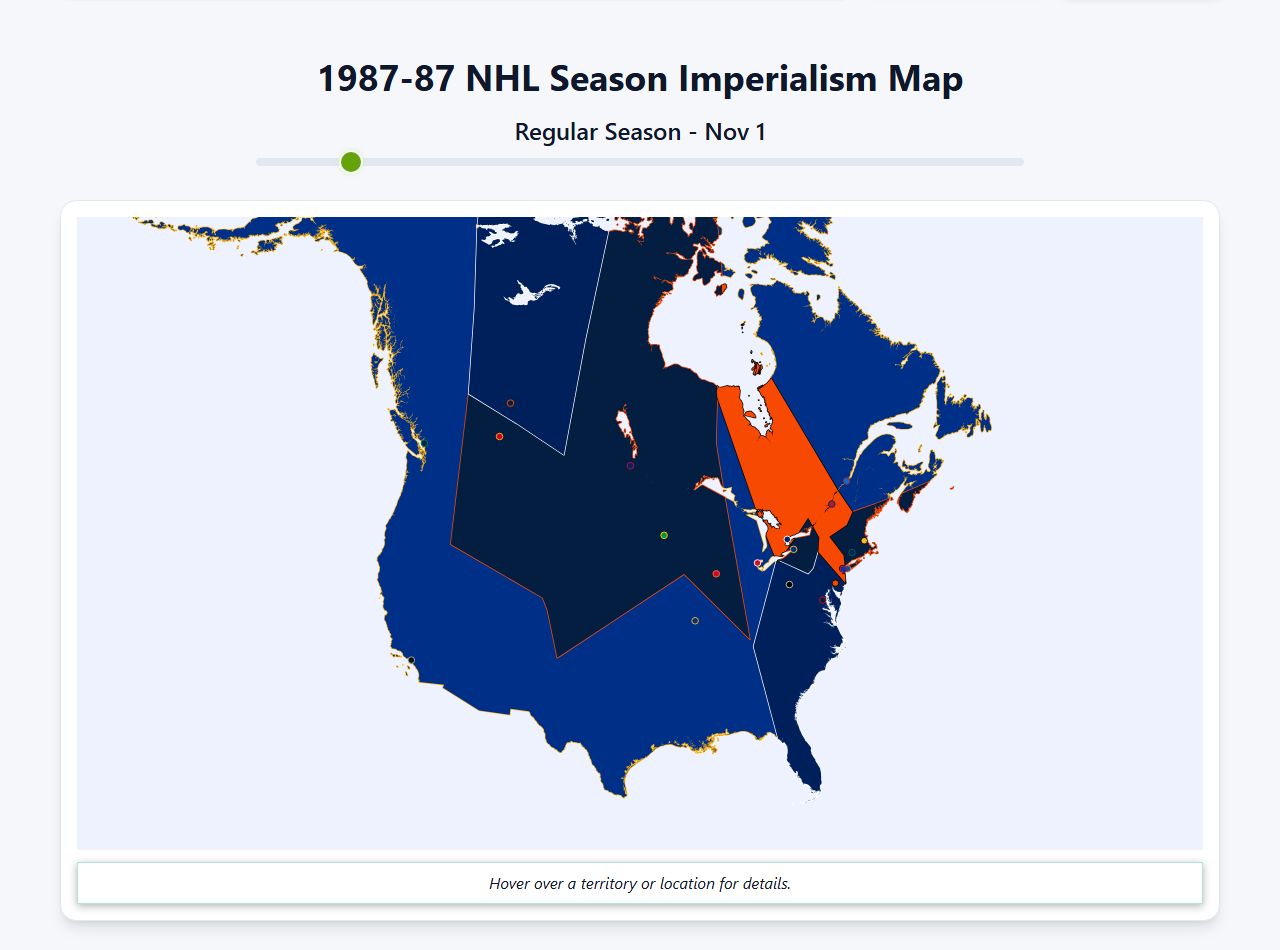
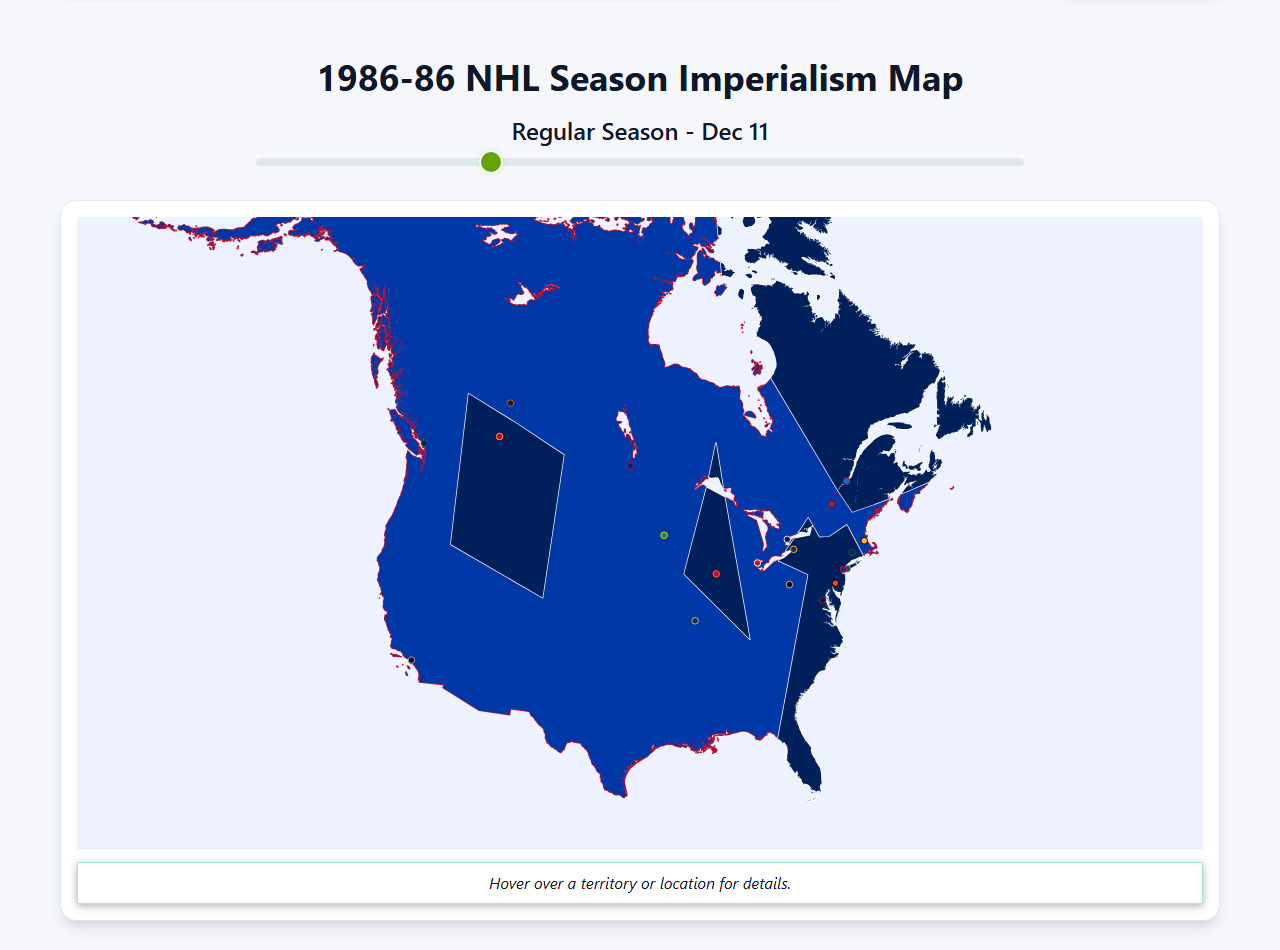
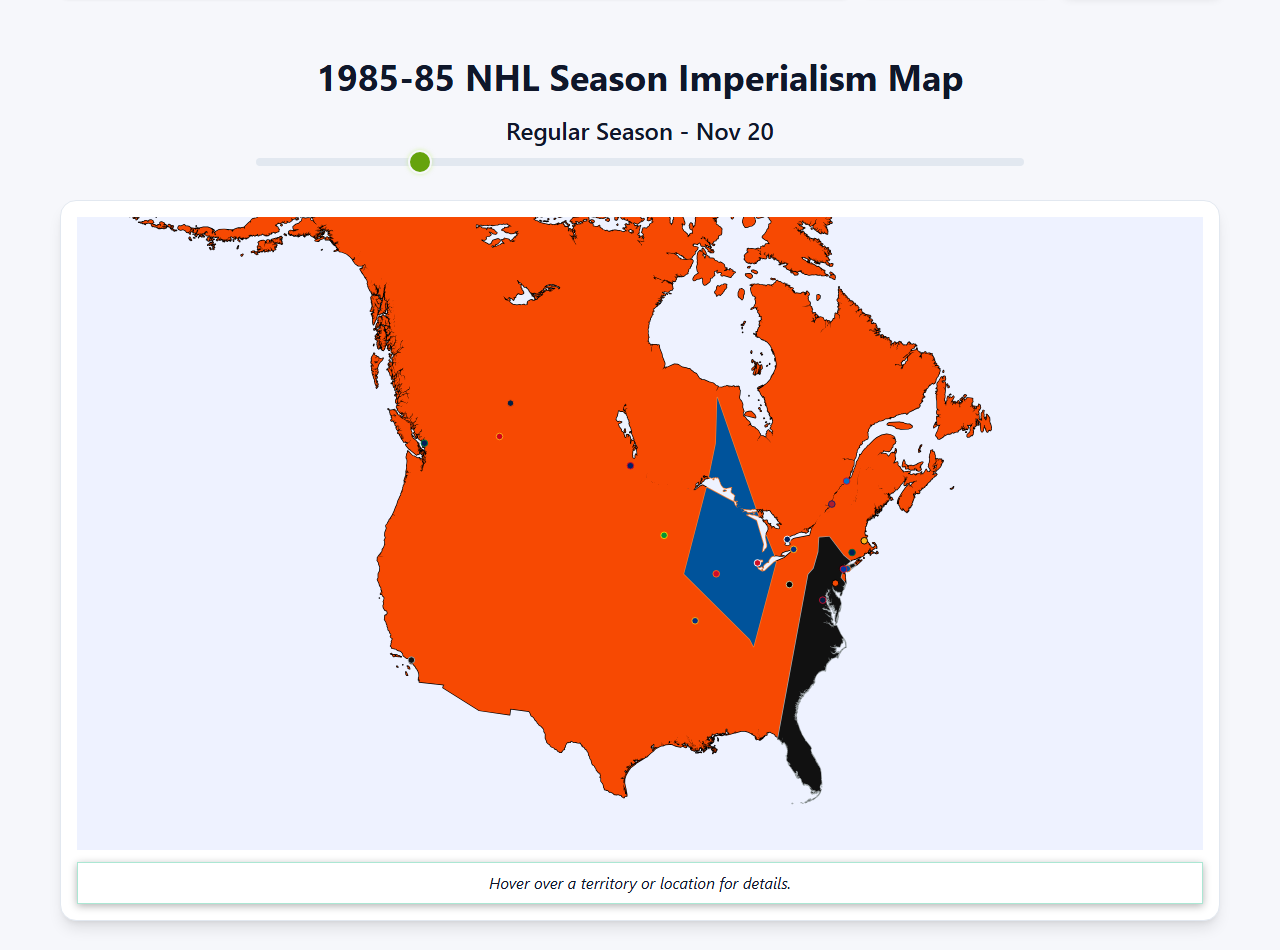
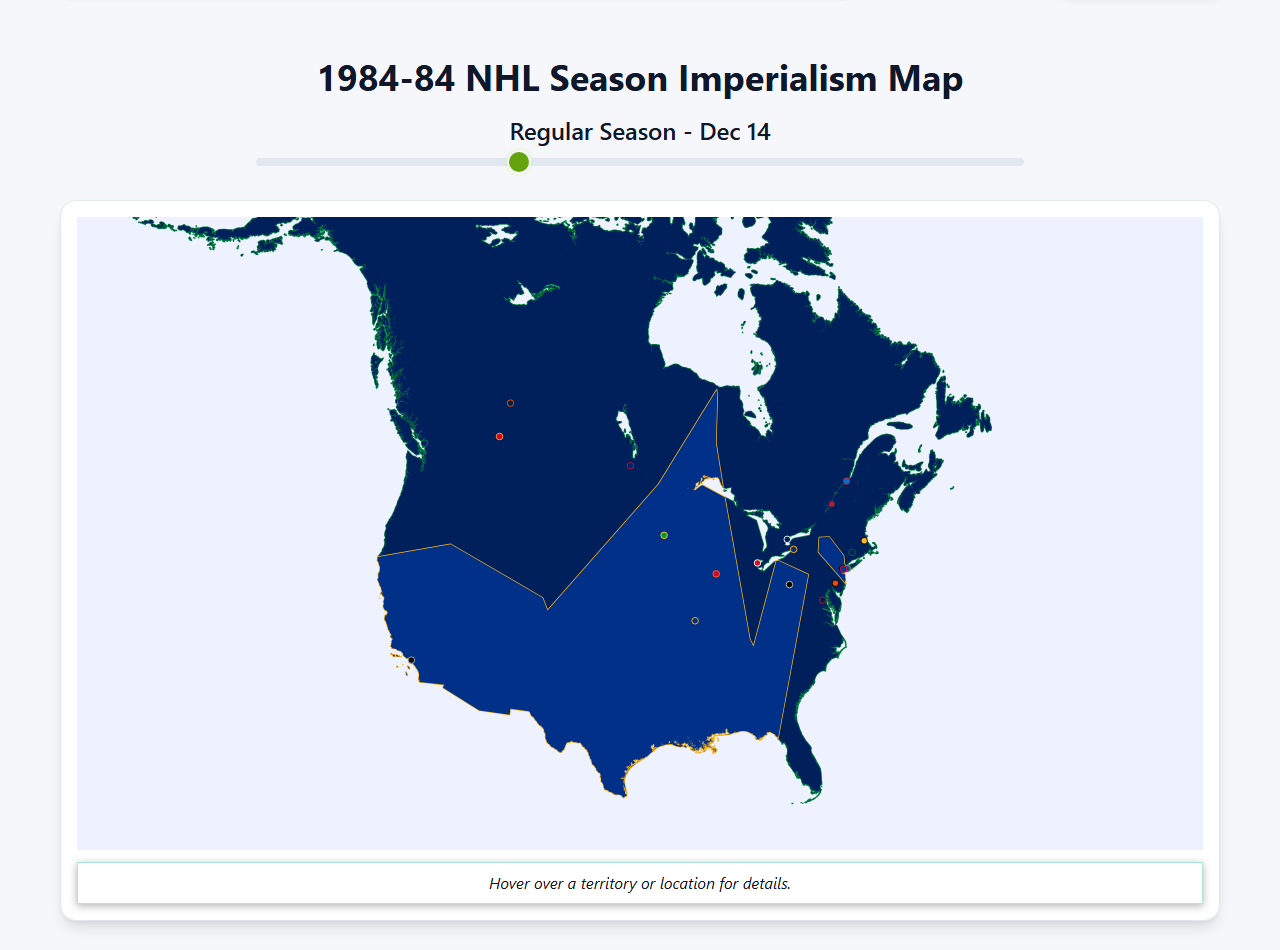
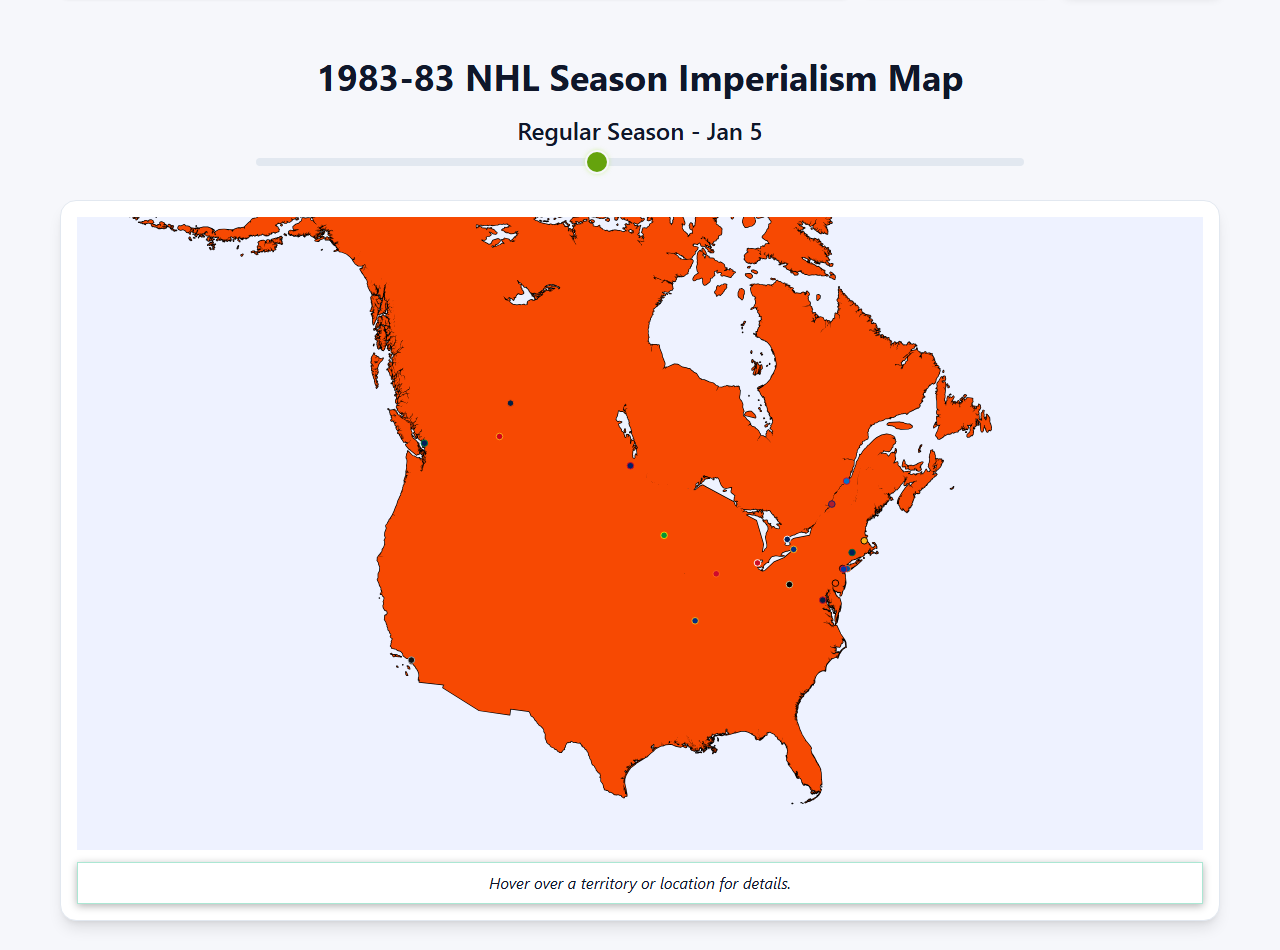
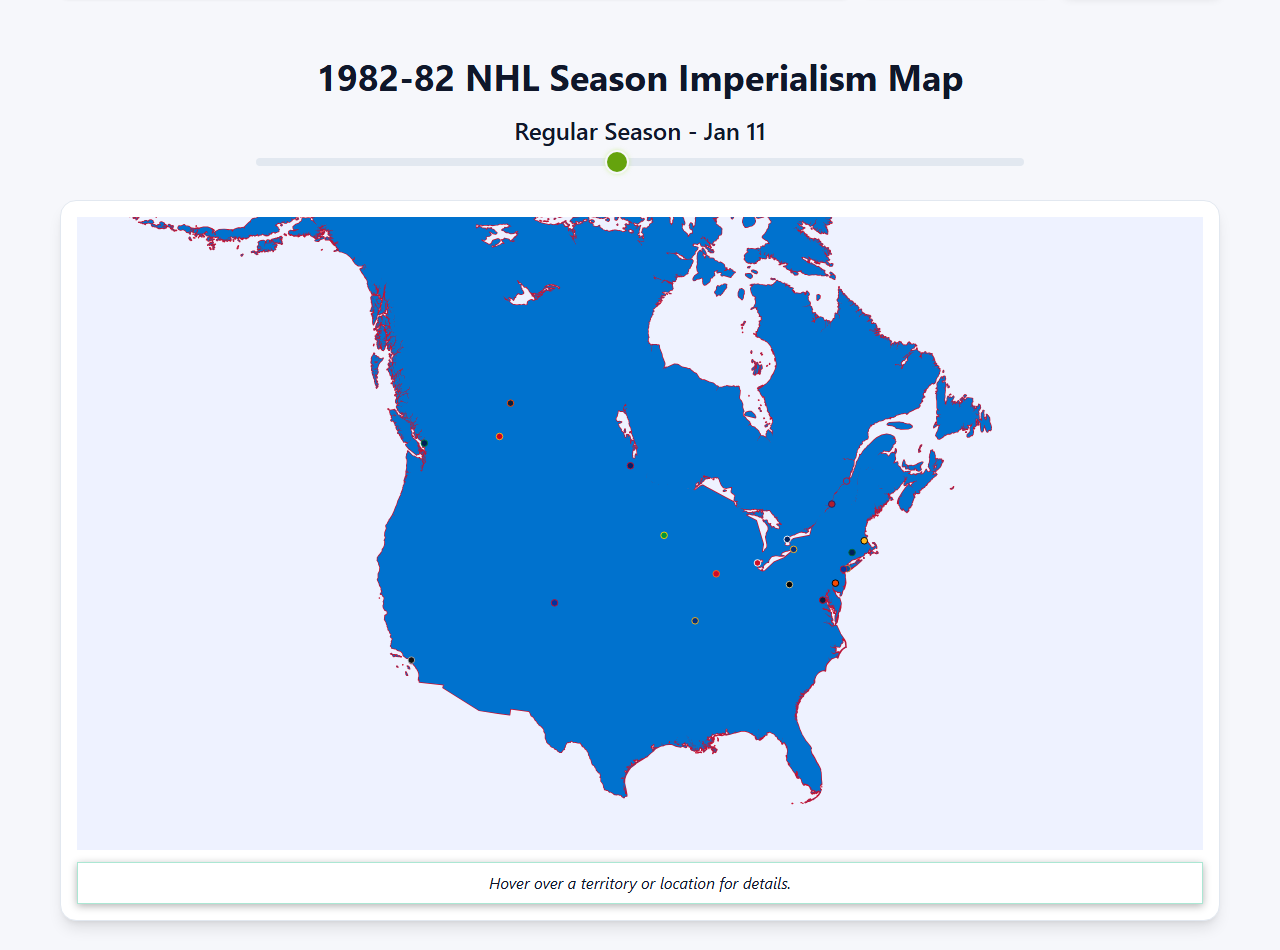
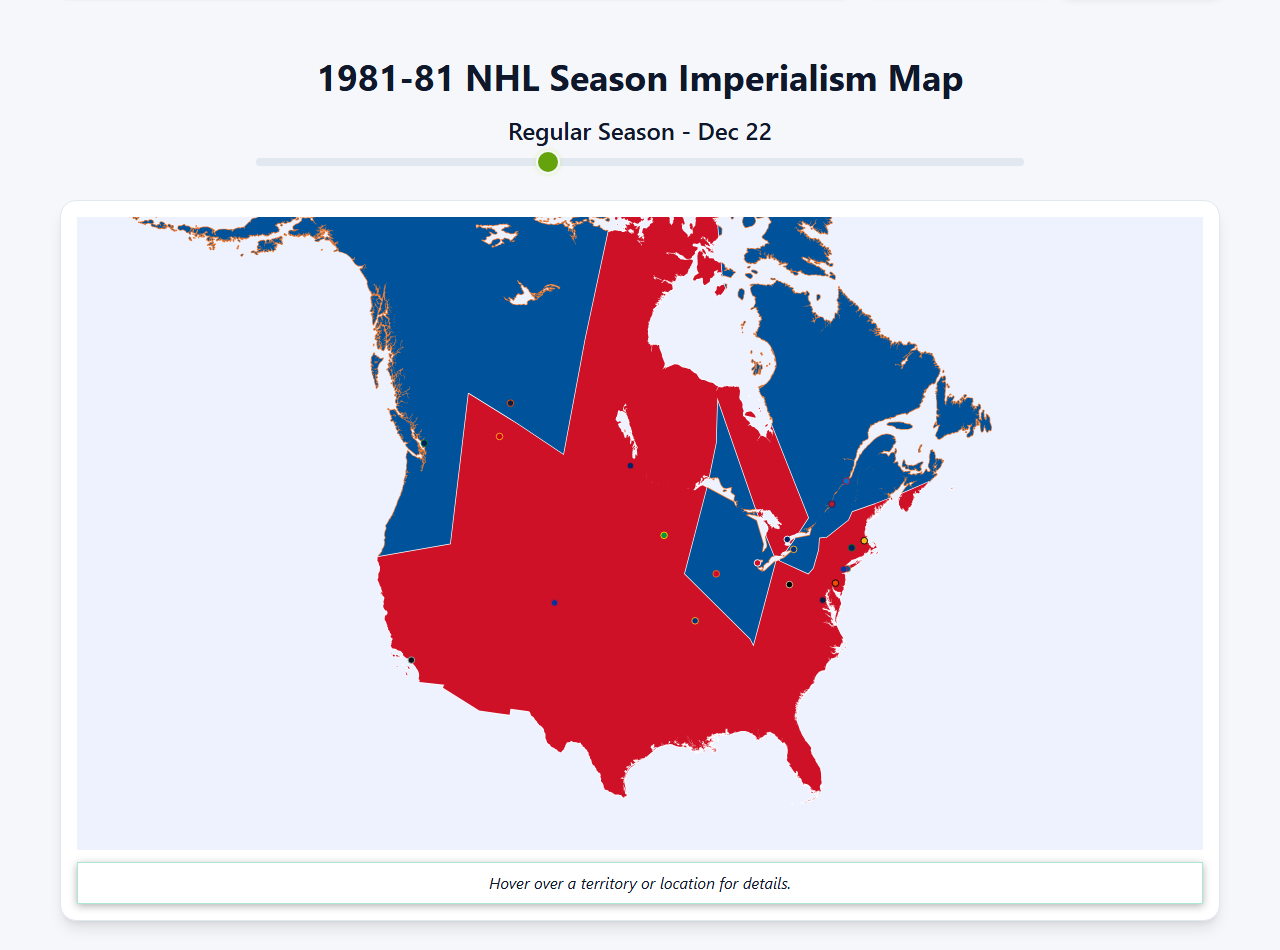
Hartford Whalers
- Led
- 11 of 230 days
- Conquered
- 33
- Peak
- 26 territories
NHL, 1980-1996
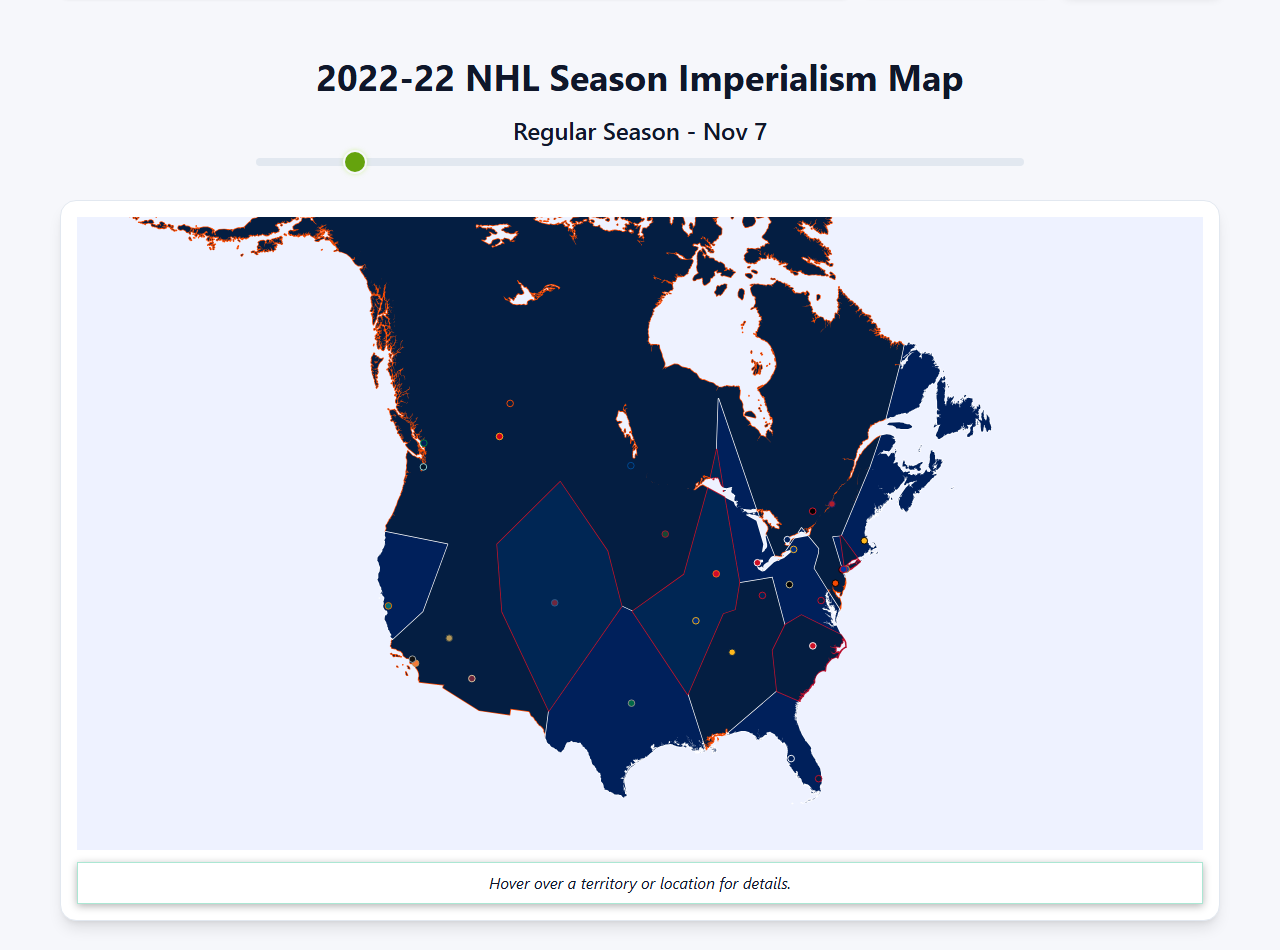
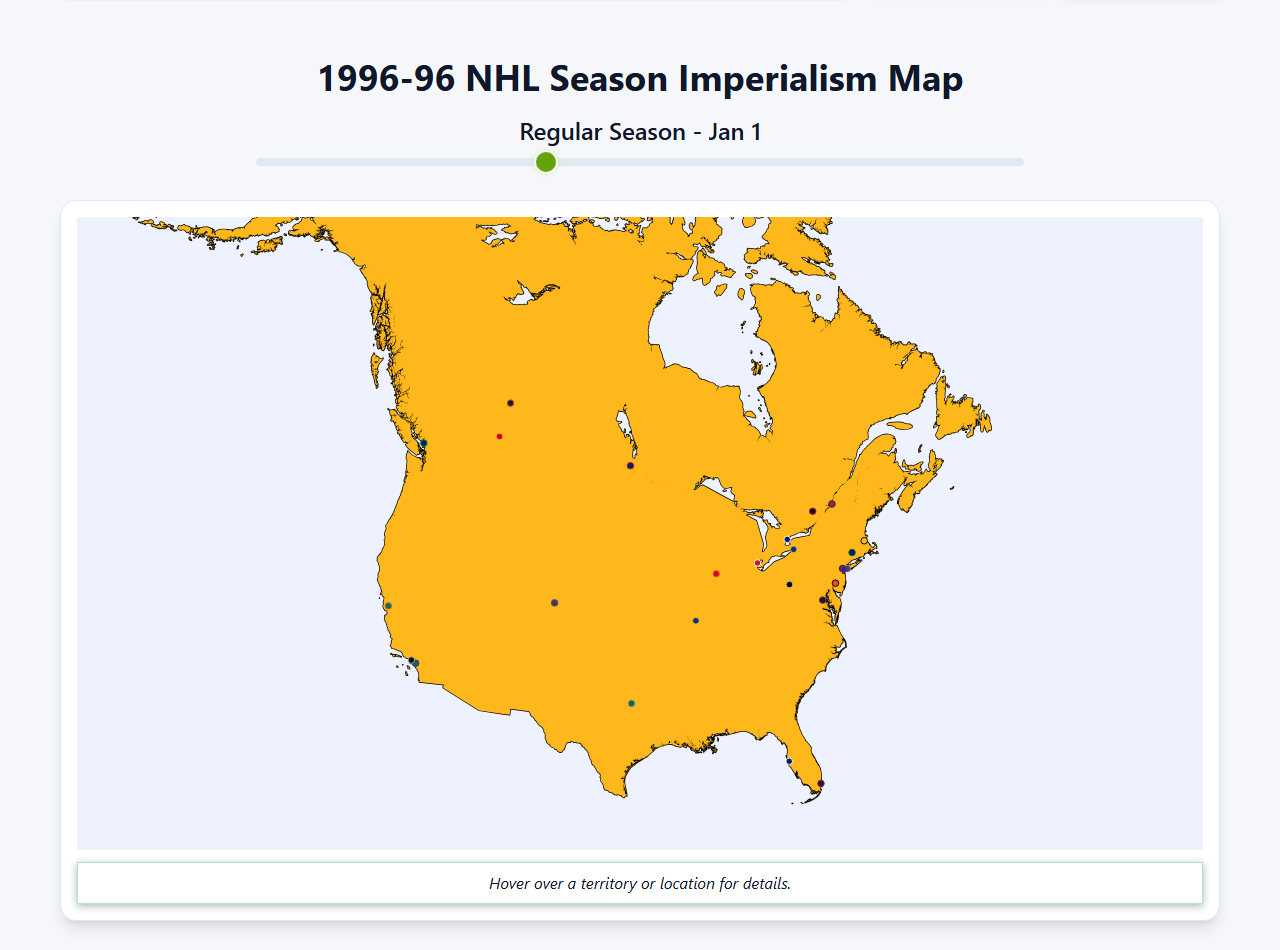
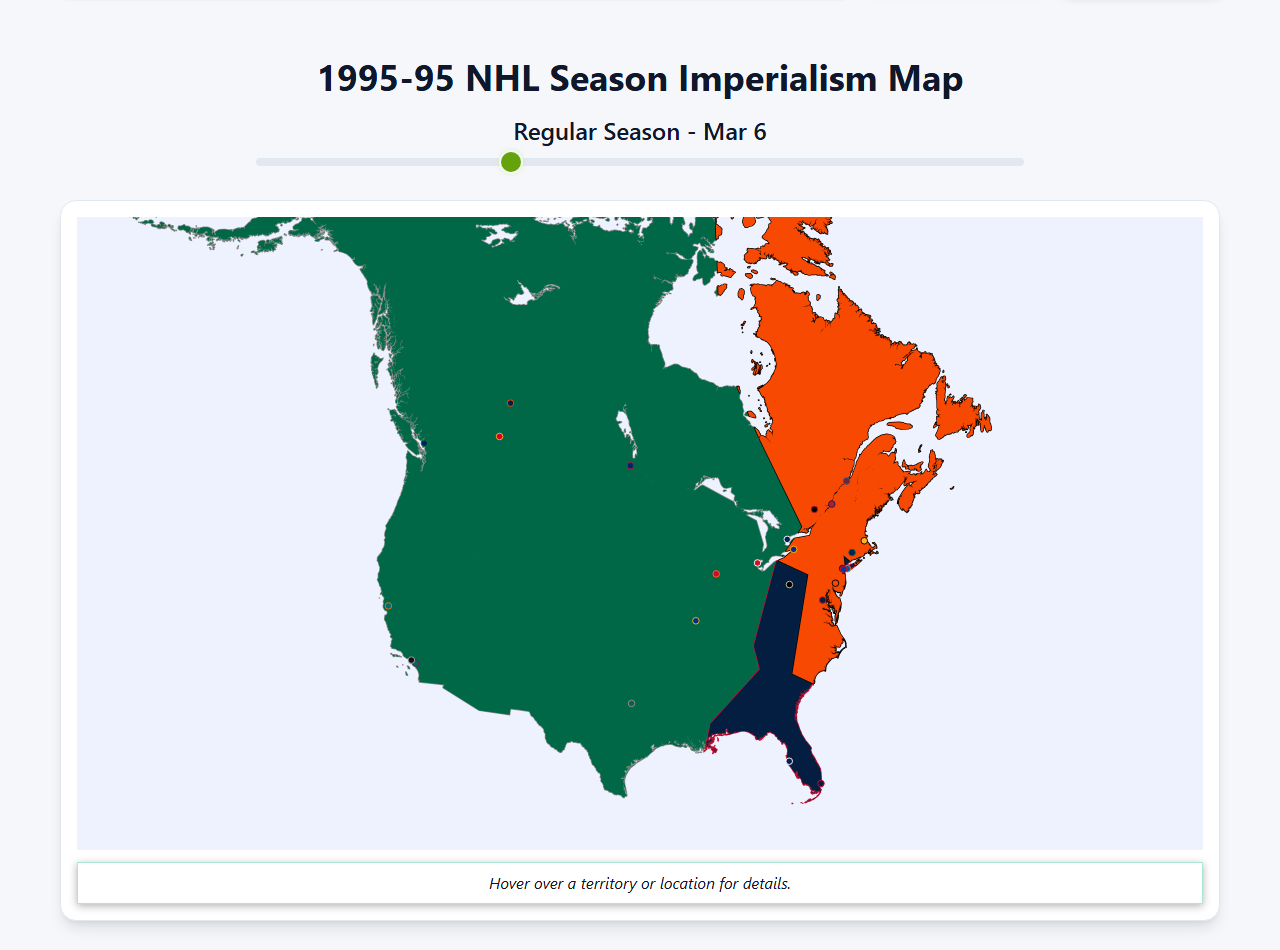
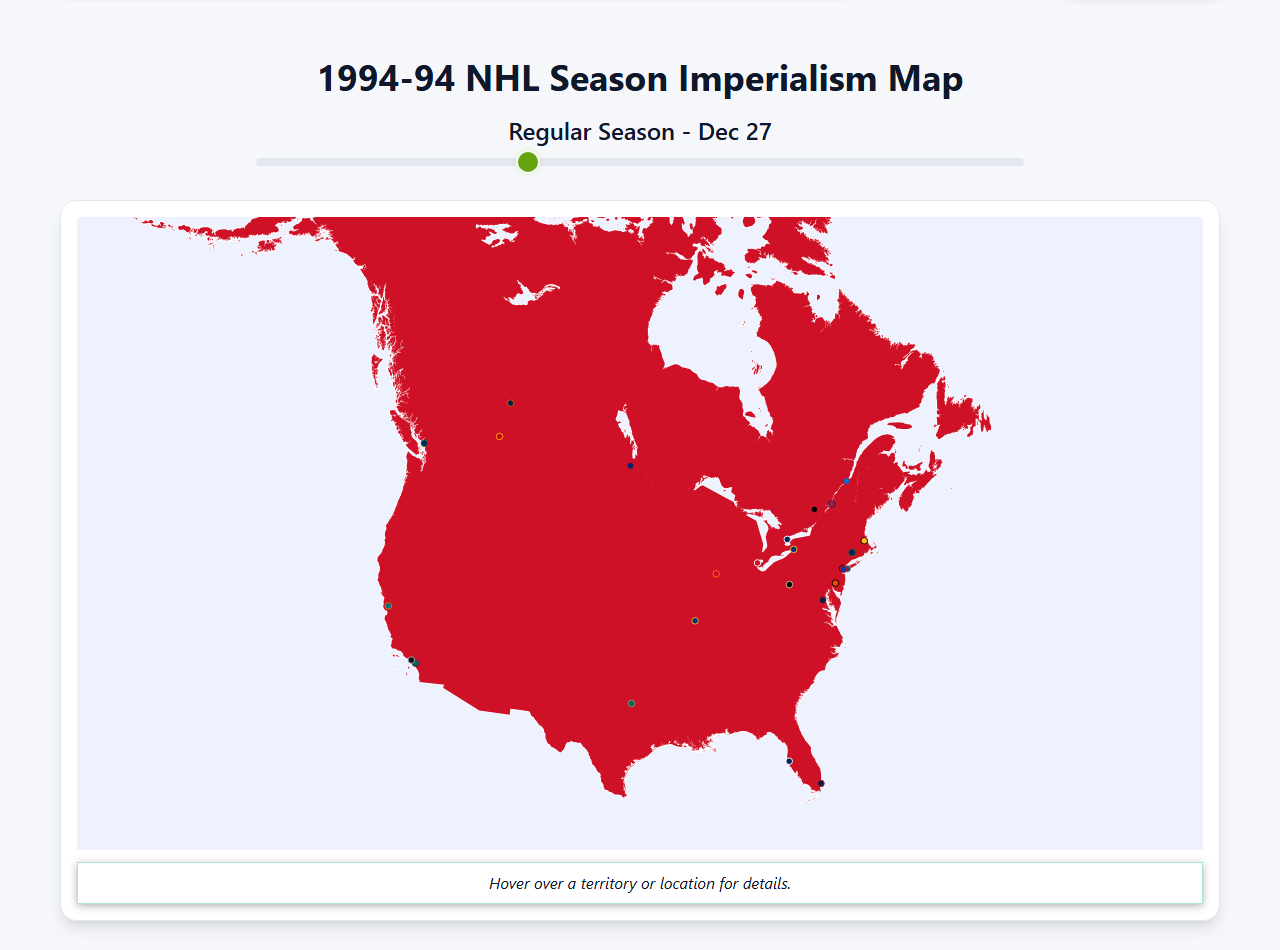
Peak: 32 territories, Regular Season - Jan 21, 2021-22
View the 2021-22 NHL Imperialism Map
Ranked by days as map leader: time spent holding more territory than any other franchise. Reign = longest unbroken streak on top. Titles = seasons ended on top. Conquered = territories ever taken. Biggest day = most taken at once.
| # | Franchise | Days Led | Longest Reign | Titles | Conquered | Biggest Day | Peak | Seasons |
|---|---|---|---|---|---|---|---|---|
| 1 | Montreal Canadiens | 1696 | 63 | 18 | 4151 | +32 | 32 | 108 |
| 2 | Boston Bruins | 1285 | 32 | 8 | 3976 | +32 | 32 | 101 |
| 3 | Toronto Maple Leafs | 1123 | 20 | 13 | 3532 | +32 | 32 | 108 |
| 4 | New York Rangers | 1061 | 31 | 6 | 3650 | +32 | 32 | 99 |
| 5 | Detroit Red Wings | 981 | 22 | 9 | 3218 | +32 | 32 | 99 |
| 6 | Chicago Blackhawks | 944 | 24 | 6 | 3246 | +32 | 32 | 99 |
| 7 | Philadelphia Flyers | 595 | 43 | 2 | 2781 | +32 | 32 | 58 |
| 8 | Dallas Stars | 466 | 24 | 2 | 2586 | +32 | 32 | 58 |
| 9 | Colorado Avalanche | 462 | 22 | 3 | 2645 | +32 | 32 | 46 |
| 10 | Buffalo Sabres | 458 | 20 | 0 | 2201 | +32 | 32 | 55 |
| 11 | Edmonton Oilers | 445 | 48 | 6 | 2189 | +32 | 32 | 46 |
| 12 | Pittsburgh Penguins | 440 | 28 | 3 | 2052 | +32 | 32 | 58 |
| 13 | St. Louis Blues | 409 | 20 | 1 | 1955 | +32 | 32 | 58 |
| 14 | Washington Capitals | 404 | 26 | 0 | 1903 | +32 | 32 | 51 |
| 15 | New York Islanders | 395 | 13 | 4 | 2225 | +32 | 32 | 53 |
| ⋯ | ||||||||
| 22 | Carolina Hurricanes This team | 257 | 19 | 2 | 1783 | +32 | 32 | 46 |
17 seasons of NHL maps. Open any one at this team's peak.
Hartford Whalers
Hartford Whalers
Hartford Whalers
Hartford Whalers
Hartford Whalers
Hartford Whalers
Hartford Whalers
Hartford Whalers
Hartford Whalers
Hartford Whalers
Hartford Whalers
Hartford Whalers
Hartford Whalers
Hartford Whalers
Hartford Whalers
Hartford Whalers
New England Whalers
Every name and league this franchise has played under
Got ideas for making these maps better? Found something weird? Want to suggest a new feature?
Data sources: Game data from ESPN; venue data from VenueStats .