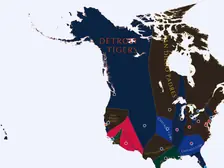
2026 MLB Imperialism Map
Minnesota Twins ended on top, led 57 of 208 days
Make your own 2026 MLB map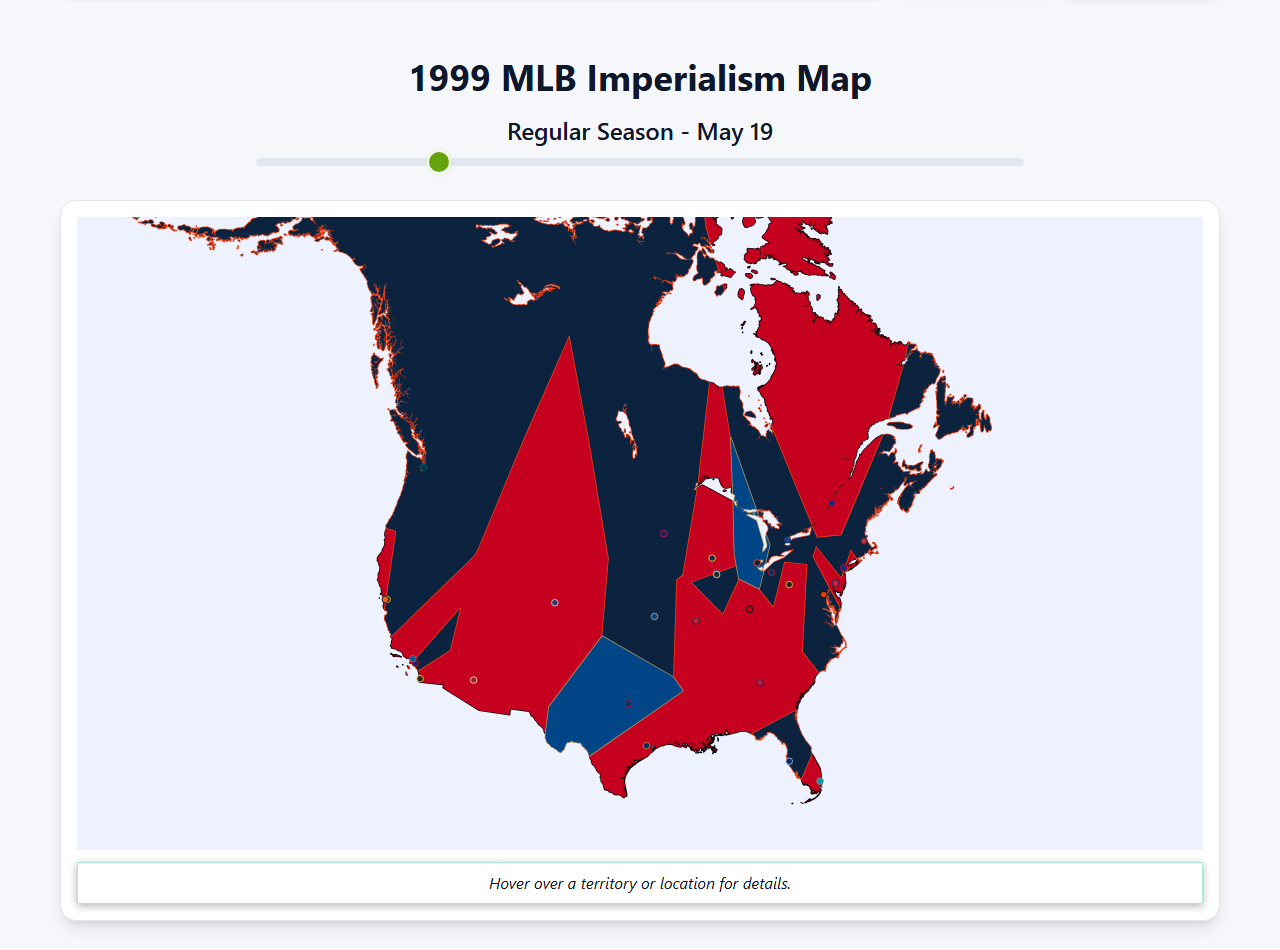
This table shows all teams sorted by the number of territories they control.
Final standings: the Chicago White Sox finished on top with 30 of 30 territories (100.0%).
| Team | Territories Controlled |
|---|---|
| Chicago White Sox | 30 (100.0%) |
Simulate your own territory battles: spin the wheel, input results, and see what happens.
Full Rules and FAQ How to make your own map
Data sources: Sports Reference (game data); VenueStats (venue data).
The standout territory feats of the season.
Each team's season at a glance — days spent leading the map, largest empire, territory conquered, and the rise-and-fall sparkline. Sorted by who dominated.
All 156 MLB seasons, 1871 to 2026. Replay any of them game by game, or make your own version.
MLB seasons of the 2020s
Minnesota Twins ended on top, led 57 of 208 days
Make your own 2026 MLB map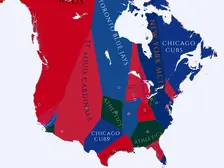
Chicago White Sox ended on top, led 32 of 210 days
Make your own 2025 MLB map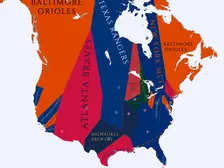
Ended on top: Chicago White Sox
Led the most days: Los Angeles Dodgers (31 of 209)
Make your own 2024 MLB map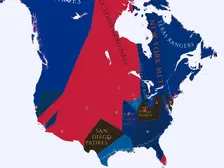
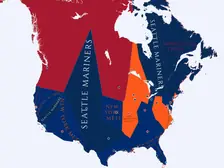
Ended on top: Houston Astros
Led the most days: Cleveland Guardians (35 of 200)
Make your own 2022 MLB map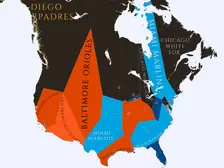
Ended on top: Chicago Cubs
Led the most days: San Francisco Giants (32 of 206)
Make your own 2021 MLB map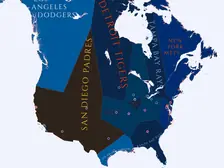
MLB seasons of the 2010s
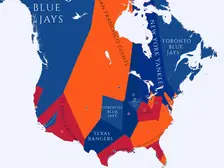
Ended on top: Chicago White Sox
Led the most days: Cleveland Indians (37 of 210)
Make your own 2019 MLB map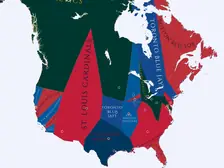
Ended on top: Boston Red Sox
Led the most days: Cleveland Indians (20 of 206)
Make your own 2018 MLB map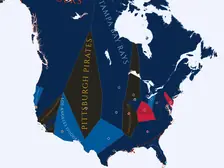
Philadelphia Phillies ended on top, led 43 of 204 days
Make your own 2017 MLB map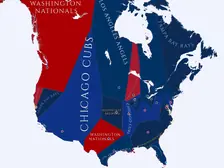
Ended on top: Philadelphia Phillies
Led the most days: New York Mets (28 of 203)
Make your own 2016 MLB map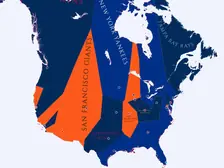
Ended on top: Kansas City Royals
Led the most days: Pittsburgh Pirates (39 of 201)
Make your own 2015 MLB map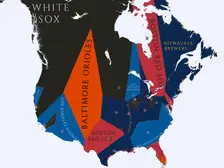
Cleveland Indians ended on top, led 41 of 202 days
Make your own 2014 MLB map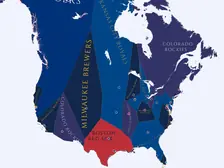
Baltimore Orioles ended on top, led 40 of 205 days
Make your own 2013 MLB map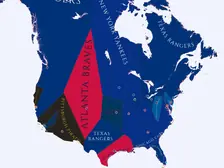
Ended on top: San Francisco Giants
Led the most days: Detroit Tigers (23 of 202)
Make your own 2012 MLB map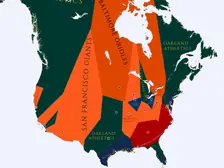
Ended on top: St. Louis Cardinals
Led the most days: Texas Rangers (30 of 203)
Make your own 2011 MLB map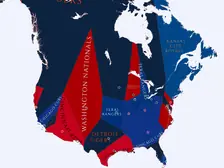
Chicago White Sox ended on top, led 43 of 201 days
Make your own 2010 MLB mapMLB seasons of the 2000s
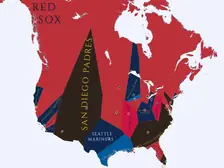
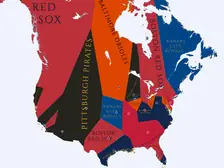
Baltimore Orioles ended on top, led 27 of 202 days
Make your own 2009 MLB map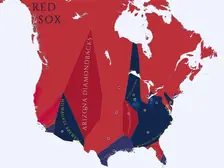
Seattle Mariners ended on top, led 27 of 200 days
Make your own 2007 MLB map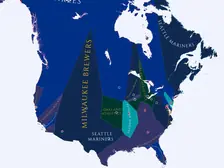
Ended on top: St. Louis Cardinals
Led the most days: Oakland Athletics (29 of 200)
Make your own 2006 MLB map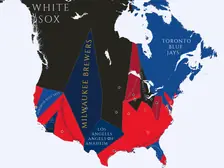
Chicago White Sox ended on top, led 27 of 199 days
Make your own 2005 MLB map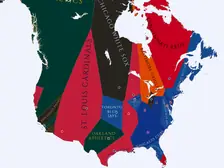
Ended on top: Boston Red Sox
Led the most days: Houston Astros (39 of 202)
Make your own 2004 MLB map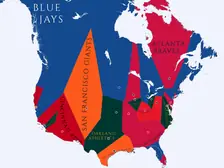
Tampa Bay Devil Rays ended on top, led 28 of 203 days
Make your own 2003 MLB map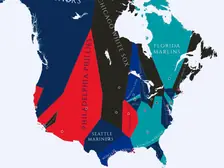
Ended on top: Anaheim Angels
Led the most days: St. Louis Cardinals (35 of 201)
Make your own 2002 MLB map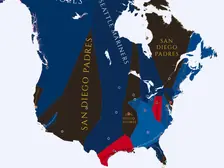
Ended on top: Arizona Diamondbacks
Led the most days: San Francisco Giants (27 of 202)
Make your own 2001 MLB map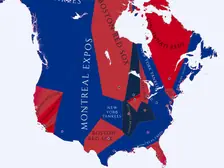
MLB seasons of the 1990s
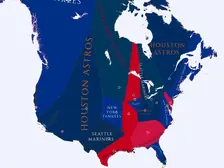
Chicago White Sox ended on top, led 33 of 200 days
Make your own 1999 MLB map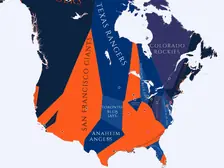
Ended on top: New York Yankees
Led the most days: San Francisco Giants (34 of 197)
Make your own 1998 MLB map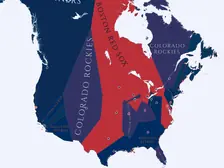
Toronto Blue Jays ended on top, led 28 of 201 days
Make your own 1997 MLB map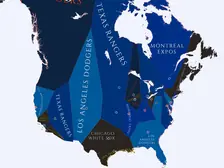
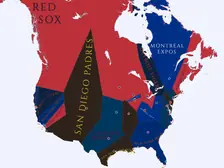
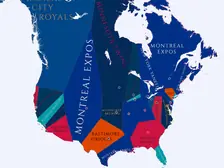
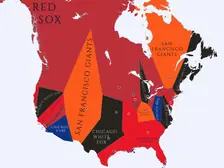
Led the most days: Toronto Blue Jays (17 of 194)
Make your own 1993 MLB map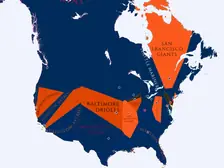
Ended on top: Toronto Blue Jays
Led the most days: Oakland Athletics (37 of 194)
Make your own 1992 MLB map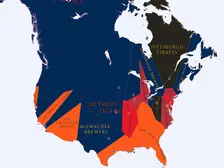
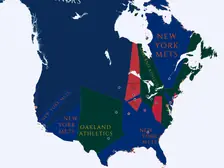
Ended on top: Cincinnati Reds
Led the most days: Oakland Athletics (29 of 188)
Make your own 1990 MLB mapMLB seasons of the 1980s
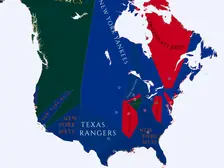
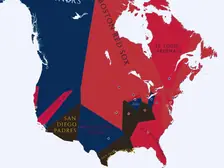
Ended on top: Los Angeles Dodgers
Led the most days: Toronto Blue Jays (26 of 192)
Make your own 1988 MLB map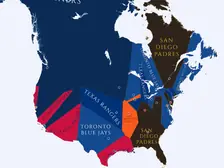
Ended on top: Boston Red Sox
Led the most days: Toronto Blue Jays (36 of 195)
Make your own 1987 MLB map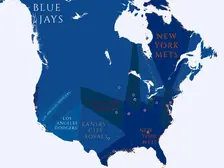
Ended on top: Oakland Athletics
Led the most days: California Angels (43 of 194)
Make your own 1986 MLB map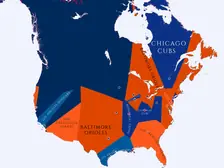
Oakland Athletics ended on top, led 31 of 193 days
Make your own 1985 MLB map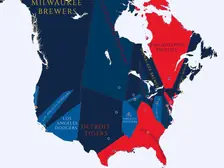
Ended on top: Milwaukee Brewers
Led the most days: Cleveland Indians (24 of 190)
Make your own 1984 MLB map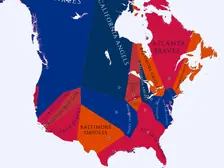
Ended on top: Minnesota Twins
Led the most days: Milwaukee Brewers (31 of 189)
Make your own 1983 MLB map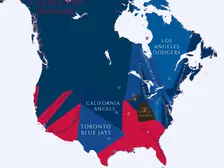
Toronto Blue Jays ended on top, led 19 of 192 days
Make your own 1982 MLB map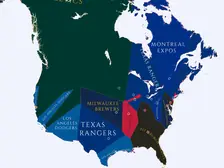
Ended on top: Los Angeles Dodgers
Led the most days: Chicago White Sox (19 of 140)
Make your own 1981 MLB map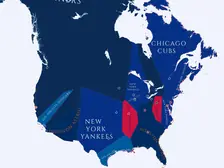
Chicago White Sox ended on top, led 27 of 190 days
Make your own 1980 MLB mapMLB seasons of the 1970s
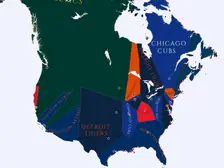
Cleveland Indians ended on top, led 24 of 189 days
Make your own 1979 MLB map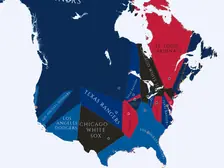
New York Yankees ended on top, led 25 of 189 days
Make your own 1978 MLB map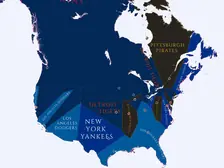
Ended on top: Cleveland Indians
Led the most days: New York Yankees (31 of 189)
Make your own 1977 MLB map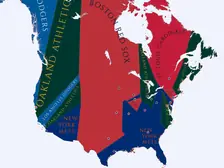
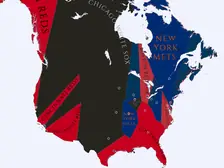
Led the most days: Pittsburgh Pirates (3 of 182)
Make your own 1975 MLB map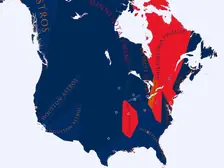
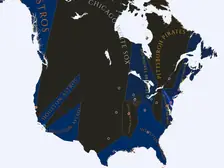
Led the most days: Los Angeles Dodgers (7 of 189)
Make your own 1973 MLB map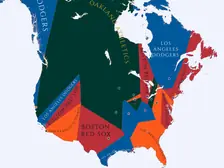
Led the most days: Pittsburgh Pirates (42 of 183)
Make your own 1972 MLB map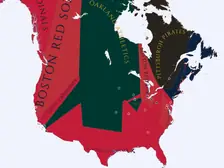
Led the most days: Baltimore Orioles (15 of 188)
Make your own 1971 MLB map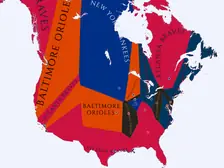
MLB seasons of the 1960s
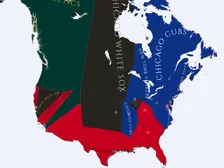
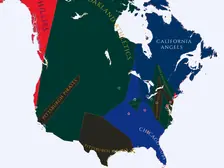
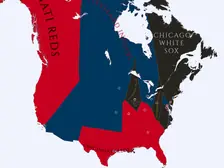
Led the most days: Chicago White Sox (18 of 180)
Make your own 1967 MLB map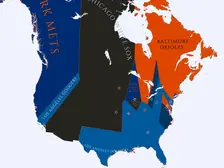
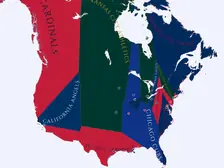
Ended on top: Los Angeles Dodgers
Led the most days: San Francisco Giants (17 of 179)
Make your own 1965 MLB map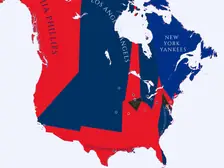
Led the most days: Philadelphia Phillies (11 of 180)
Make your own 1964 MLB map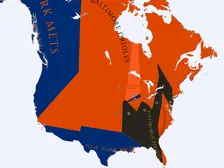
Led the most days: Los Angeles Angels (9 of 176)
Make your own 1963 MLB map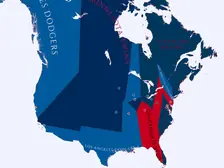
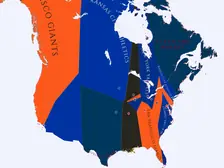
Ended on top: Cleveland Indians
Led the most days: New York Yankees (32 of 174)
Make your own 1961 MLB map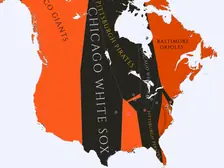
MLB seasons of the 1950s
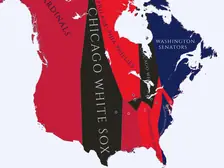
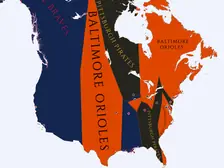
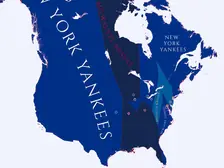
Led the most days: Cincinnati Redlegs (10 of 168)
Make your own 1957 MLB map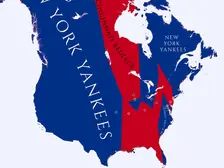
Led the most days: St. Louis Cardinals (1 of 169)
Make your own 1956 MLB map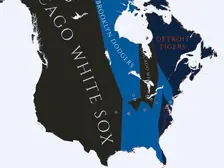
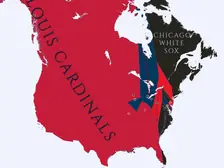
Led the most days: St. Louis Cardinals (4 of 165)
Make your own 1954 MLB map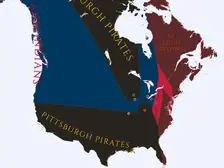
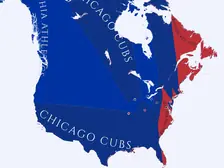
Led the most days: Philadelphia Phillies (1 of 168)
Make your own 1952 MLB map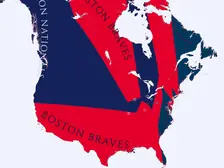
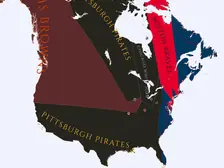
MLB seasons of the 1940s
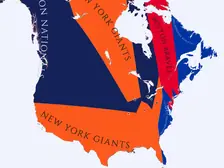
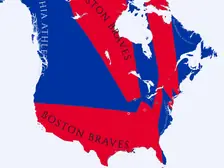
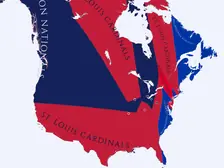
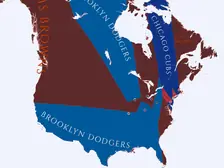
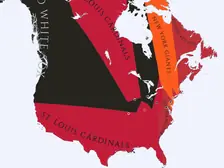
Led the most days: Cleveland Indians (16 of 162)
Make your own 1945 MLB map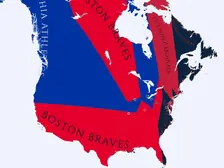
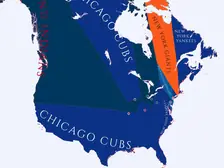
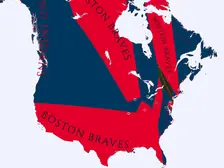
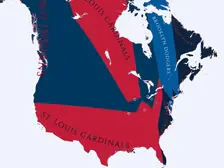
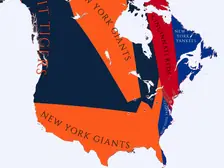
MLB seasons of the 1930s
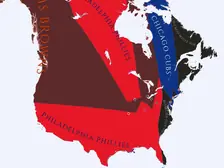
Led the most days: St. Louis Cardinals (4 of 166)
Make your own 1939 MLB map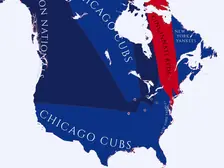
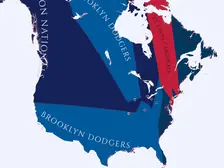
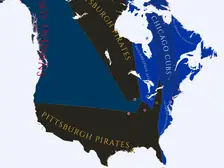
Led the most days: Cleveland Indians (18 of 167)
Make your own 1936 MLB map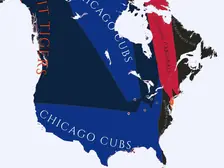
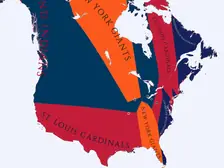
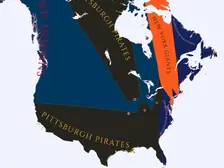
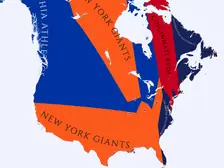
Led the most days: Washington Nationals (4 of 171)
Make your own 1932 MLB map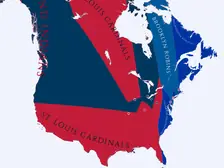
Led the most days: Philadelphia Athletics (2 of 174)
Make your own 1931 MLB map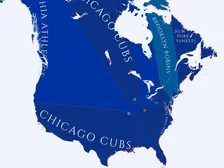
Led the most days: St. Louis Cardinals (8 of 174)
Make your own 1930 MLB mapMLB seasons of the 1920s
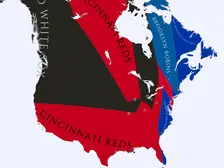
Led the most days: Philadelphia Phillies (4 of 178)
Make your own 1929 MLB map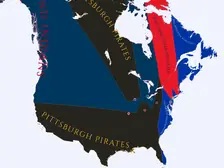
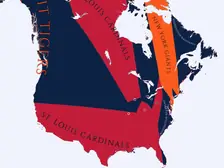
Led the most days: Pittsburgh Pirates (14 of 178)
Make your own 1927 MLB map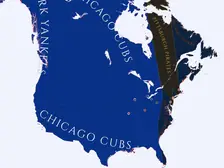
Led the most days: Pittsburgh Pirates (2 of 176)
Make your own 1926 MLB map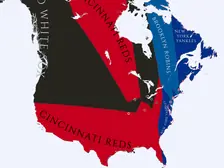
Led the most days: Philadelphia Athletics (10 of 179)
Make your own 1925 MLB map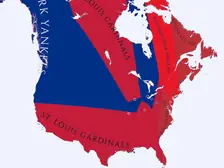
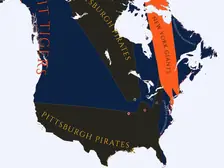
Led the most days: Philadelphia Athletics (5 of 178)
Make your own 1923 MLB map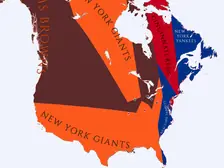
Led the most days: Washington Nationals (4 of 178)
Make your own 1922 MLB map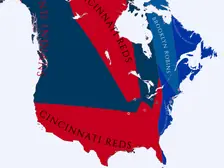
Led the most days: Cleveland Indians (26 of 181)
Make your own 1921 MLB map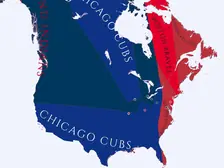
Led the most days: Cleveland Indians (12 of 179)
Make your own 1920 MLB mapMLB seasons of the 1910s
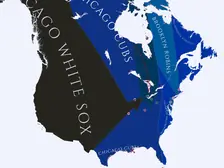
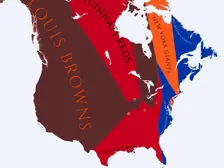
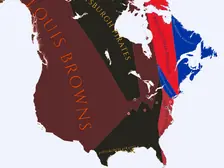
Led the most days: Philadelphia Athletics (10 of 182)
Make your own 1917 MLB map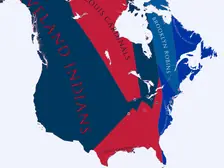
Led the most days: Philadelphia Phillies (5 of 182)
Make your own 1916 MLB map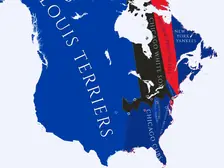
Led the most days: Kansas City Packers (7 of 185)
Make your own 1915 MLB map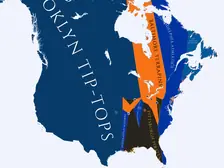
Led the most days: Baltimore Terrapins (8 of 183)
Make your own 1914 MLB map
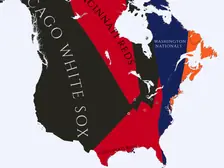
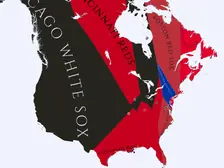
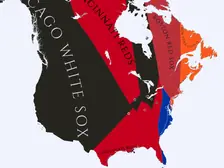
MLB seasons of the 1900s
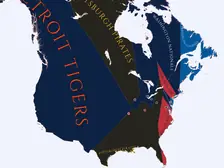
Led the most days: Pittsburgh Pirates (25 of 185)
Make your own 1909 MLB map
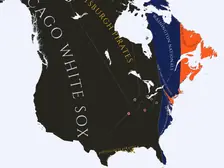
Led the most days: New York Highlanders (4 of 184)
Make your own 1907 MLB map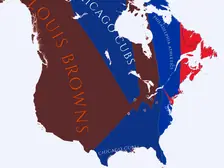

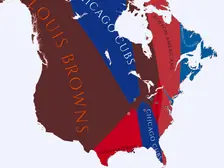
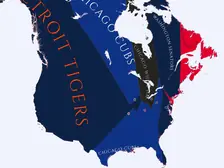
Led the most days: Cleveland Napoleons (22 of 175)
Make your own 1903 MLB map
Led the most days: Pittsburgh Pirates (6 of 171)
Make your own 1902 MLB map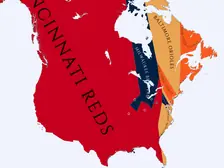
Led the most days: St. Louis Cardinals (12 of 168)
Make your own 1901 MLB map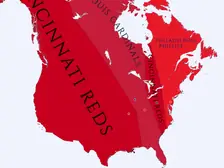
Brooklyn Superbas ended on top, led 47 of 167 days
Make your own 1900 MLB mapMLB seasons of the 1890s
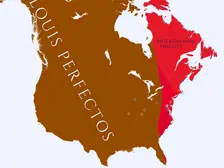
Ended on top: Brooklyn Superbas
Led the most days: Boston Beaneaters (36 of 185)
Make your own 1899 MLB map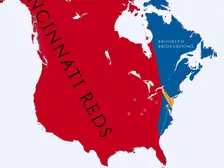
Ended on top: Chicago Orphans
Led the most days: Cincinnati Reds (38 of 180)
Make your own 1898 MLB map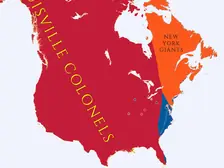
Ended on top: Washington Senators
Led the most days: Baltimore Orioles (37 of 158)
Make your own 1897 MLB map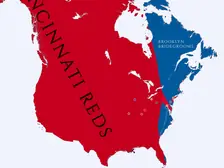
Ended on top: New York Giants
Led the most days: Cincinnati Reds (36 of 157)
Make your own 1896 MLB map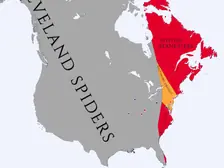
Ended on top: Louisville Colonels
Led the most days: Cleveland Spiders (50 of 157)
Make your own 1895 MLB map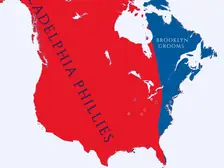
Ended on top: Cincinnati Reds
Led the most days: Baltimore Orioles (14 of 157)
Make your own 1894 MLB map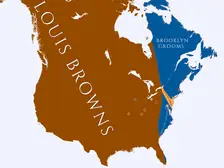
Ended on top: Cincinnati Reds
Led the most days: Pittsburgh Pirates (41 of 152)
Make your own 1893 MLB map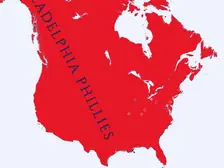
Ended on top: New York Giants
Led the most days: Boston Beaneaters (31 of 177)
Make your own 1892 MLB map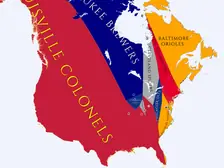
Ended on top: Milwaukee Brewers
Led the most days: Louisville Colonels (14 of 175)
Make your own 1891 MLB map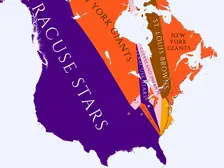
Louisville Colonels ended on top, led 21 of 182 days
Make your own 1890 MLB mapMLB seasons of the 1880s
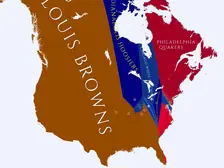
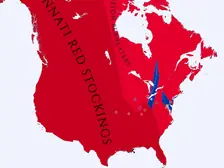
Led the most days: Detroit Wolverines (16 of 183)
Make your own 1888 MLB map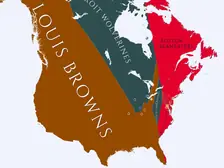
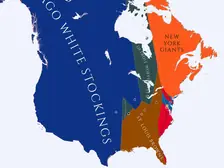
Led the most days: Detroit Wolverines (8 of 182)
Make your own 1886 MLB map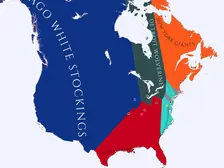
Led the most days: Chicago White Stockings (15 of 168)
Make your own 1885 MLB map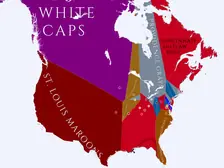
Ended on top: Philadelphia Athletics
Led the most days: Louisville Eclipse (32 of 184)
Make your own 1884 MLB map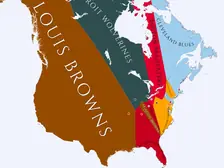

Chicago White Stockings ended on top, led 51 of 146 days
Make your own 1882 MLB map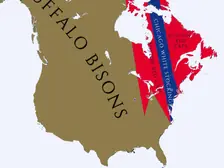
Providence Grays ended on top, led 33 of 111 days
Make your own 1881 MLB map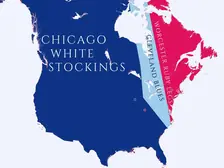
Ended on top: Boston Red Caps
Led the most days: Chicago White Stockings (33 of 112)
Make your own 1880 MLB mapMLB seasons of the 1870s
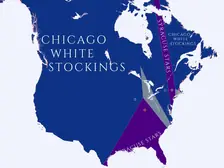
Ended on top: Providence Grays
Led the most days: Boston Red Caps (26 of 110)
Make your own 1879 MLB map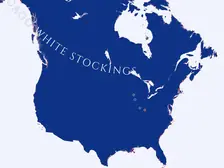
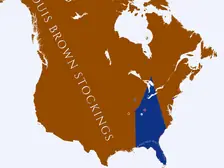
Boston Red Caps ended on top, led 40 of 106 days
Make your own 1877 MLB map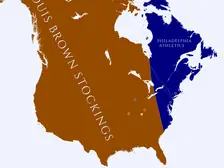
Ended on top: St. Louis Brown Stockings
Led the most days: Chicago White Stockings (59 of 105)
Make your own 1876 MLB map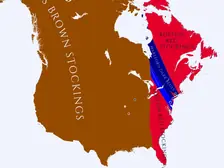
Ended on top: Philadelphia Athletics
Led the most days: Boston Red Stockings (67 of 154)
Make your own 1875 MLB map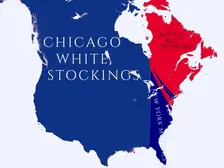
Ended on top: Hartford Dark Blues
Led the most days: Philadelphia Athletics (60 of 132)
Make your own 1874 MLB map
Ended on top: Brooklyn Atlantics
Led the most days: Philadelphia White Stockings (61 of 135)
Make your own 1873 MLB map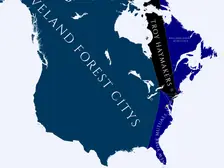
Ended on top: Philadelphia Athletics
Led the most days: Baltimore Canaries (42 of 116)
Make your own 1872 MLB map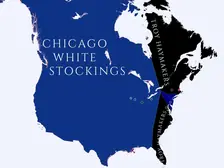
Fort Wayne Kekiongas ended on top, led 31 of 94 days
Make your own 1871 MLB map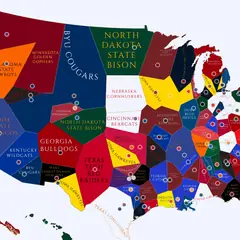


Got ideas for making these maps better? Found something weird? Want to suggest a new feature?