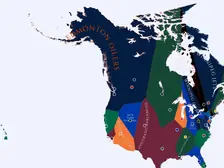
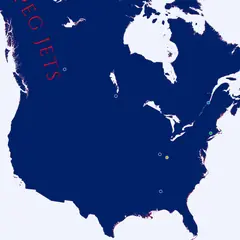
2026-27 NHL Imperialism Map
Live
Leading now: Ottawa Senators
Led the most days: Winnipeg Jets (8 of 52)
Make your own 2026-27 NHL map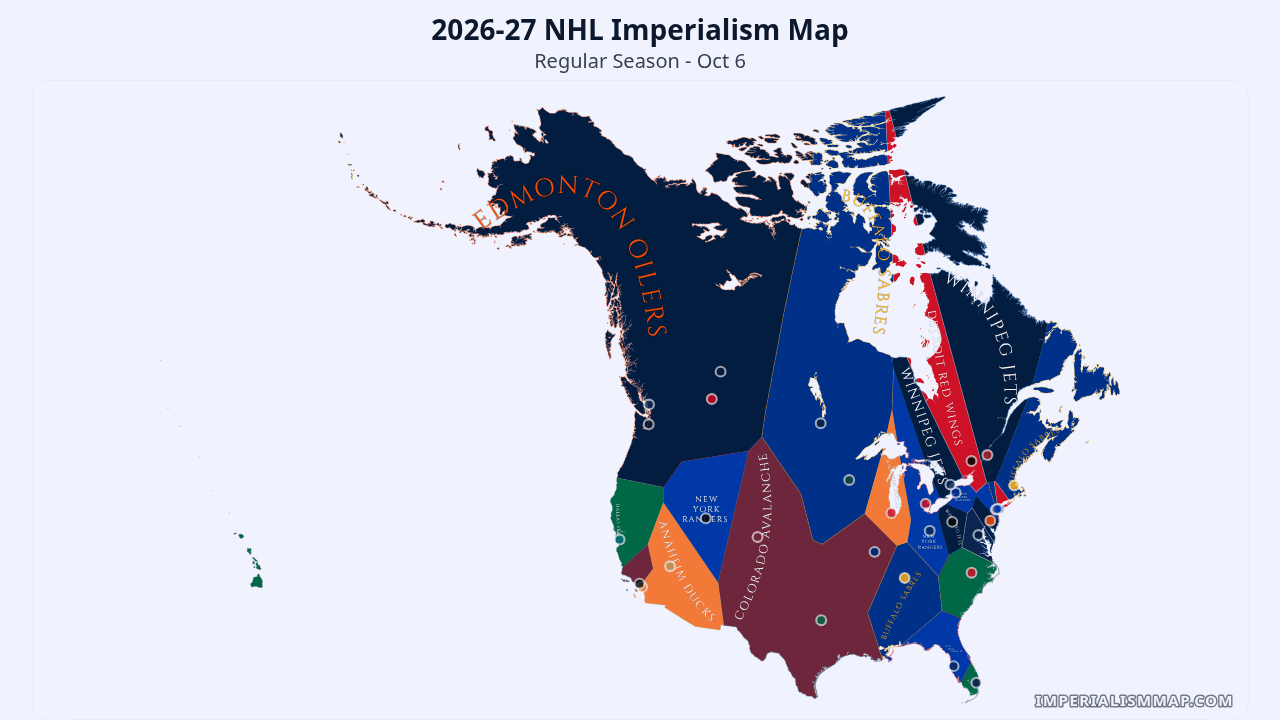
This table shows all teams sorted by the number of territories they control.
Current standings: the Ottawa Senators lead with 23 of 32 territories (71.9%).
| Team | Territories Controlled |
|---|---|
| Ottawa Senators | 23 (71.9%) |
| Calgary Flames | 9 (28.1%) |
Simulate your own territory battles: spin the wheel, input results, and see what happens.
Full Rules and FAQ How to make your own map
Data sources: ESPN (game data); VenueStats (venue data).
The standout territory feats of the season.
Each team's season at a glance — days spent leading the map, largest empire, territory conquered, and the rise-and-fall sparkline. Sorted by who dominated.
All 109 NHL seasons, 1917-18 to 2026-27. Replay any of them game by game, or make your own version.
NHL seasons of the 2020s
Leading now: Ottawa Senators
Led the most days: Winnipeg Jets (8 of 52)
Make your own 2026-27 NHL map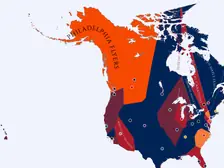
Ended on top: Carolina Hurricanes
Led the most days: Vegas Golden Knights (36 of 211)
Make your own 2025-26 NHL map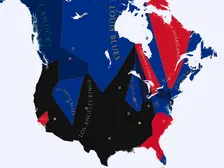
Florida Panthers ended on top, led 27 of 224 days
Make your own 2024-25 NHL map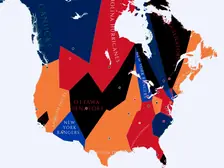
Columbus Blue Jackets ended on top, led 52 of 232 days
Make your own 2023-24 NHL map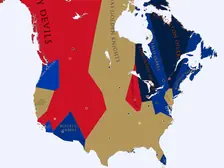
Vegas Golden Knights ended on top, led 34 of 222 days
Make your own 2022-23 NHL map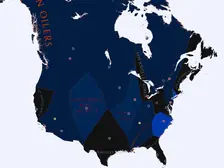
Colorado Avalanche ended on top, led 38 of 232 days
Make your own 2021-22 NHL map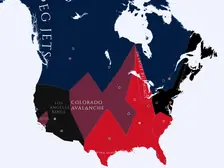
Ended on top: Tampa Bay Lightning
Led the most days: Toronto Maple Leafs (12 of 167)
Make your own 2020-21 NHL map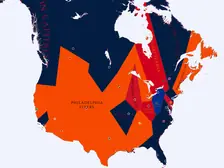
Los Angeles Kings ended on top, led 63 of 205 days
Make your own 2019-20 NHL mapNHL seasons of the 2010s
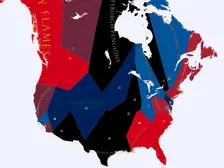
Ended on top: St. Louis Blues
Led the most days: Boston Bruins (31 of 223)
Make your own 2018-19 NHL map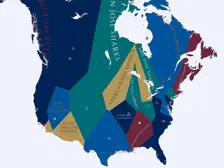
Edmonton Oilers ended on top, led 52 of 223 days
Make your own 2017-18 NHL map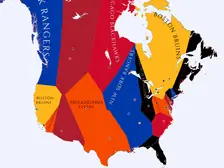
Winnipeg Jets ended on top, led 63 of 218 days
Make your own 2016-17 NHL map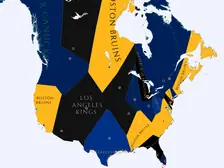
Ottawa Senators ended on top, led 55 of 226 days
Make your own 2015-16 NHL map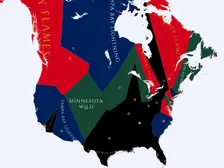
Ended on top: Chicago Blackhawks
Led the most days: Los Angeles Kings (25 of 225)
Make your own 2014-15 NHL map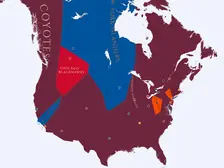
Winnipeg Jets ended on top, led 52 of 224 days
Make your own 2013-14 NHL map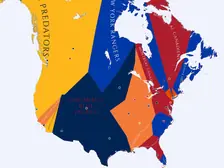
Led the most days: Chicago Blackhawks (11 of 144)
Make your own 2012-13 NHL map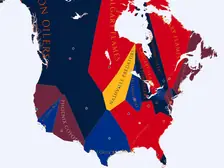
Calgary Flames ended on top, led 54 of 224 days
Make your own 2011-12 NHL map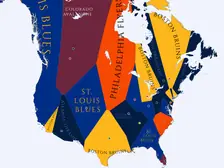
Ended on top: Boston Bruins
Led the most days: Vancouver Canucks (40 of 226)
Make your own 2010-11 NHL map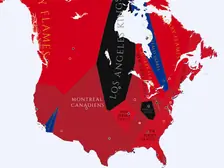
Ended on top: Chicago Blackhawks
Led the most days: San Jose Sharks (42 of 218)
Make your own 2009-10 NHL mapNHL seasons of the 2000s
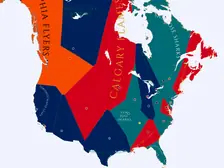
Florida Panthers ended on top, led 58 of 225 days
Make your own 2008-09 NHL map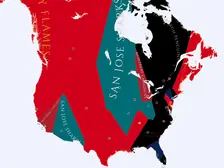
Detroit Red Wings ended on top, led 39 of 225 days
Make your own 2007-08 NHL map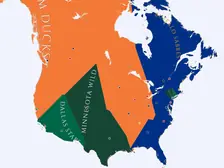
Ended on top: Anaheim Ducks
Led the most days: Minnesota Wild (22 of 222)
Make your own 2006-07 NHL map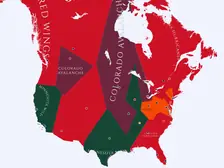
Ended on top: Carolina Hurricanes
Led the most days: Buffalo Sabres (61 of 222)
Make your own 2005-06 NHL map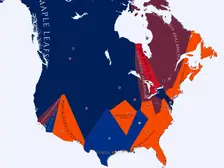
Columbus Blue Jackets ended on top, led 49 of 220 days
Make your own 2003-04 NHL map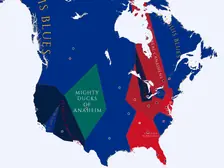
Ended on top: New Jersey Devils
Led the most days: Toronto Maple Leafs (21 of 218)
Make your own 2002-03 NHL map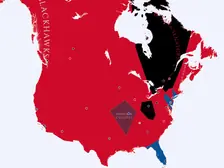
Ended on top: Detroit Red Wings
Led the most days: Colorado Avalanche (40 of 220)
Make your own 2001-02 NHL map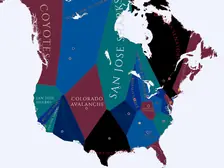
Ended on top: Colorado Avalanche
Led the most days: New Jersey Devils (27 of 225)
Make your own 2000-01 NHL map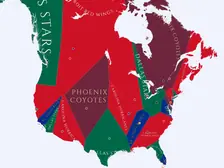
Ended on top: New Jersey Devils
Led the most days: Colorado Avalanche (44 of 230)
Make your own 1999-00 NHL mapNHL seasons of the 1990s
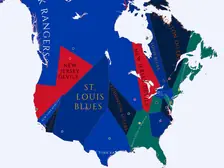
Dallas Stars ended on top, led 40 of 230 days
Make your own 1998-99 NHL map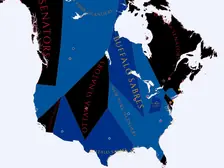
Ended on top: Detroit Red Wings
Led the most days: New Jersey Devils (29 of 218)
Make your own 1997-98 NHL map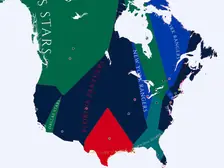
Ended on top: Detroit Red Wings
Led the most days: Florida Panthers (32 of 222)
Make your own 1996-97 NHL map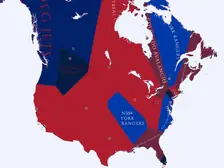
Ended on top: Colorado Avalanche
Led the most days: Florida Panthers (45 of 230)
Make your own 1995-96 NHL map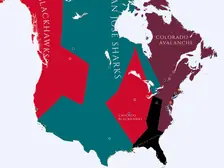
New Jersey Devils ended on top, led 23 of 141 days
Make your own 1994-95 NHL map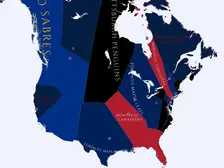
Ended on top: New York Rangers
Led the most days: Toronto Maple Leafs (49 of 232)
Make your own 1993-94 NHL map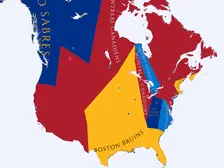
Montreal Canadiens ended on top, led 51 of 230 days
Make your own 1992-93 NHL map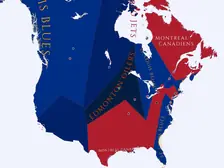
Ended on top: Pittsburgh Penguins
Led the most days: Boston Bruins (37 of 216)
Make your own 1991-92 NHL map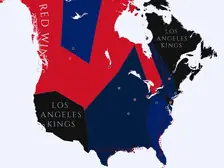
Ended on top: Pittsburgh Penguins
Led the most days: Calgary Flames (30 of 216)
Make your own 1990-91 NHL map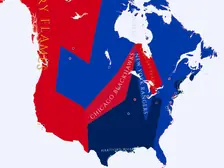
Ended on top: Edmonton Oilers
Led the most days: Washington Capitals (27 of 212)
Make your own 1989-90 NHL mapNHL seasons of the 1980s
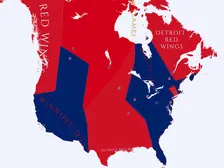
Ended on top: Calgary Flames
Led the most days: Montreal Canadiens (44 of 208)
Make your own 1988-89 NHL map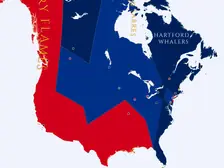
Edmonton Oilers ended on top, led 39 of 209 days
Make your own 1987-88 NHL map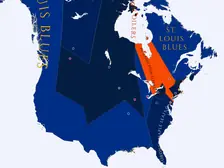
Ended on top: Edmonton Oilers
Led the most days: Montreal Canadiens (40 of 207)
Make your own 1986-87 NHL map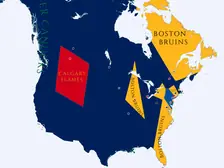
Ended on top: Montreal Canadiens
Led the most days: Washington Capitals (40 of 210)
Make your own 1985-86 NHL map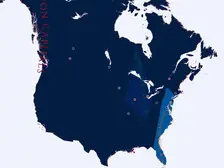
Edmonton Oilers ended on top, led 44 of 196 days
Make your own 1984-85 NHL map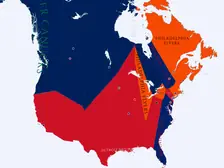
Ended on top: Edmonton Oilers
Led the most days: Boston Bruins (29 of 190)
Make your own 1983-84 NHL map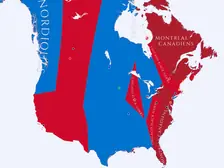
Ended on top: New York Islanders
Led the most days: Chicago Black Hawks (34 of 192)
Make your own 1982-83 NHL map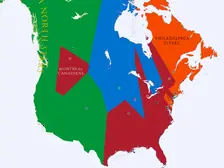
Ended on top: New York Islanders
Led the most days: Edmonton Oilers (38 of 192)
Make your own 1981-82 NHL map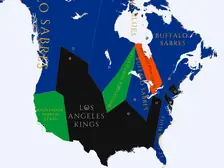
Ended on top: New York Islanders
Led the most days: Buffalo Sabres (35 of 191)
Make your own 1980-81 NHL map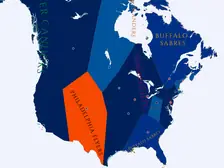
Ended on top: New York Islanders
Led the most days: Philadelphia Flyers (51 of 197)
Make your own 1979-80 NHL mapNHL seasons of the 1970s
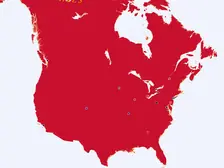
Montreal Canadiens ended on top, led 45 of 180 days
Make your own 1978-79 NHL map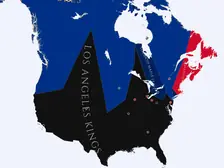
Ended on top: Minnesota North Stars
Led the most days: Montreal Canadiens (66 of 190)
Make your own 1977-78 NHL map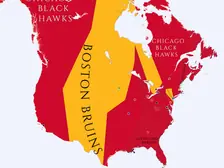
Montreal Canadiens ended on top, led 70 of 192 days
Make your own 1976-77 NHL map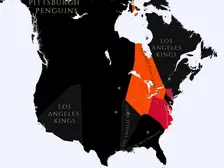
Ended on top: California Golden Seals
Led the most days: Montreal Canadiens (39 of 185)
Make your own 1975-76 NHL map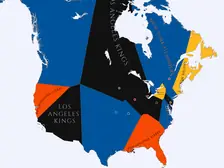
Philadelphia Flyers ended on top, led 42 of 189 days
Make your own 1974-75 NHL map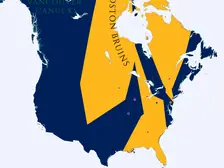
Philadelphia Flyers ended on top, led 55 of 176 days
Make your own 1973-74 NHL map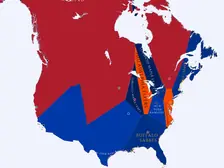
Ended on top: Toronto Maple Leafs
Led the most days: New York Rangers (30 of 165)
Make your own 1972-73 NHL map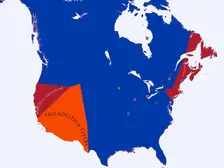
Boston Bruins ended on top, led 41 of 164 days
Make your own 1971-72 NHL map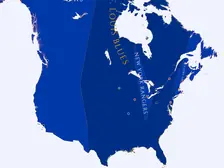
Ended on top: Montreal Canadiens
Led the most days: Boston Bruins (44 of 172)
Make your own 1970-71 NHL map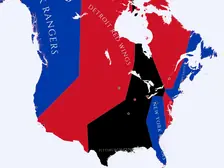
Ended on top: Boston Bruins
Led the most days: Montreal Canadiens (34 of 151)
Make your own 1969-70 NHL mapNHL seasons of the 1960s
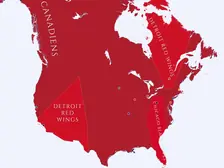
Ended on top: Montreal Canadiens
Led the most days: Boston Bruins (46 of 139)
Make your own 1968-69 NHL map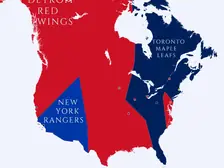
Pittsburgh Penguins ended on top, led 29 of 142 days
Make your own 1967-68 NHL map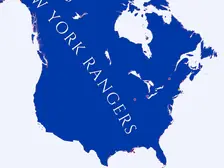
Ended on top: Toronto Maple Leafs
Led the most days: Chicago Black Hawks (36 of 108)
Make your own 1966-67 NHL map
Montreal Canadiens ended on top, led 44 of 106 days
Make your own 1965-66 NHL map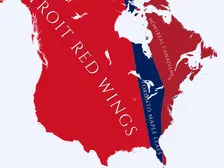
Montreal Canadiens ended on top, led 34 of 117 days
Make your own 1964-65 NHL map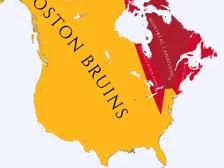
Ended on top: Toronto Maple Leafs
Led the most days: Detroit Red Wings (30 of 114)
Make your own 1963-64 NHL map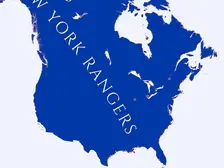
Toronto Maple Leafs ended on top, led 41 of 113 days
Make your own 1962-63 NHL map
Ended on top: Toronto Maple Leafs
Led the most days: Montreal Canadiens (35 of 111)
Make your own 1961-62 NHL map
Ended on top: Boston Bruins
Led the most days: Toronto Maple Leafs (34 of 116)
Make your own 1960-61 NHL map
Ended on top: New York Rangers
Led the most days: Montreal Canadiens (36 of 114)
Make your own 1959-60 NHL mapNHL seasons of the 1950s

Montreal Canadiens ended on top, led 55 of 107 days
Make your own 1958-59 NHL map
Ended on top: Montreal Canadiens
Led the most days: New York Rangers (19 of 114)
Make your own 1957-58 NHL map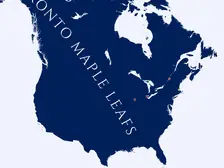
Montreal Canadiens ended on top, led 34 of 113 days
Make your own 1956-57 NHL map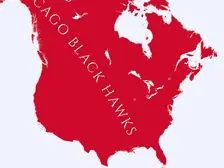
Ended on top: Chicago Black Hawks
Led the most days: Montreal Canadiens (40 of 121)
Make your own 1955-56 NHL map
Detroit Red Wings ended on top, led 46 of 113 days
Make your own 1954-55 NHL map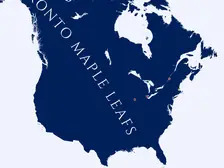
Ended on top: Detroit Red Wings
Led the most days: Boston Bruins (41 of 117)
Make your own 1953-54 NHL map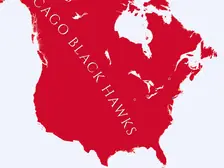
Ended on top: Toronto Maple Leafs
Led the most days: Detroit Red Wings (27 of 111)
Make your own 1952-53 NHL map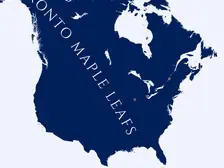
Detroit Red Wings ended on top, led 55 of 127 days
Make your own 1951-52 NHL map
Ended on top: Toronto Maple Leafs
Led the most days: Detroit Red Wings (53 of 114)
Make your own 1950-51 NHL map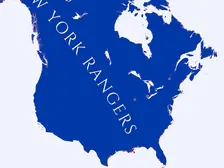
Chicago Black Hawks ended on top, led 33 of 111 days
Make your own 1949-50 NHL mapNHL seasons of the 1940s
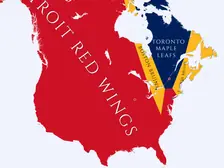
Ended on top: Toronto Maple Leafs
Led the most days: Detroit Red Wings (30 of 99)
Make your own 1948-49 NHL map
Toronto Maple Leafs ended on top, led 37 of 98 days
Make your own 1947-48 NHL map
Ended on top: Toronto Maple Leafs
Led the most days: Montreal Canadiens (32 of 103)
Make your own 1946-47 NHL map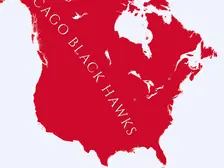
Ended on top: New York Rangers
Led the most days: Detroit Red Wings (23 of 88)
Make your own 1945-46 NHL map
Ended on top: Chicago Black Hawks
Led the most days: Montreal Canadiens (50 of 103)
Make your own 1944-45 NHL map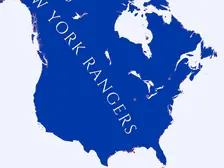
Montreal Canadiens ended on top, led 37 of 91 days
Make your own 1943-44 NHL map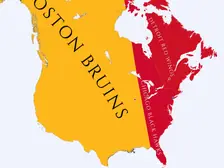
Ended on top: Detroit Red Wings
Led the most days: Boston Bruins (31 of 88)
Make your own 1942-43 NHL map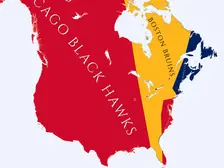
Ended on top: Toronto Maple Leafs
Led the most days: New York Rangers (38 of 94)
Make your own 1941-42 NHL map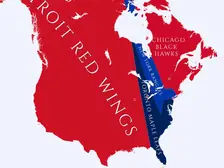
Ended on top: Boston Bruins
Led the most days: New York Rangers (22 of 97)
Make your own 1940-41 NHL map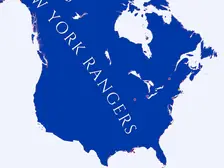
New York Rangers ended on top, led 46 of 99 days
Make your own 1939-40 NHL mapNHL seasons of the 1930s
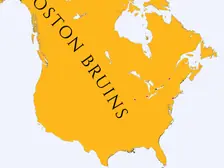
Boston Bruins ended on top, led 44 of 91 days
Make your own 1938-39 NHL map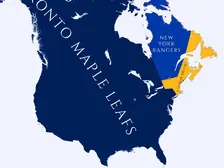
Ended on top: Chicago Black Hawks
Led the most days: Boston Bruins (23 of 91)
Make your own 1937-38 NHL map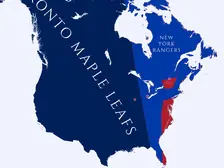
Ended on top: Detroit Red Wings
Led the most days: Montreal Maroons (21 of 92)
Make your own 1936-37 NHL map
Ended on top: New York Rangers
Led the most days: Toronto Maple Leafs (21 of 90)
Make your own 1935-36 NHL map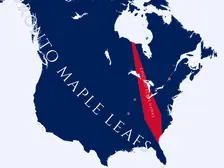
Ended on top: Montreal Maroons
Led the most days: Boston Bruins (19 of 84)
Make your own 1934-35 NHL map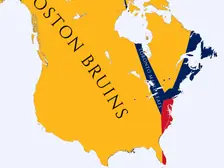
Boston Bruins ended on top, led 24 of 89 days
Make your own 1933-34 NHL map
Ended on top: New York Rangers
Led the most days: Boston Bruins (25 of 88)
Make your own 1932-33 NHL map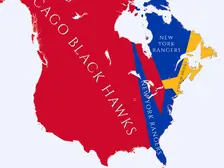
Toronto Maple Leafs ended on top, led 30 of 99 days
Make your own 1931-32 NHL map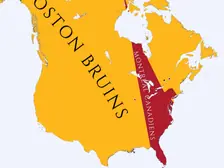
Ended on top: Montreal Canadiens
Led the most days: Toronto Maple Leafs (20 of 89)
Make your own 1930-31 NHL map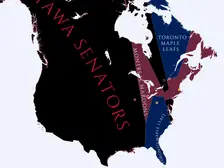
Ended on top: Montreal Canadiens
Led the most days: Boston Bruins (33 of 84)
Make your own 1929-30 NHL mapNHL seasons of the 1920s
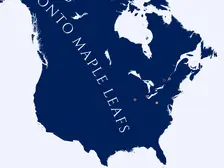
Ottawa Senators ended on top, led 21 of 79 days
Make your own 1928-29 NHL map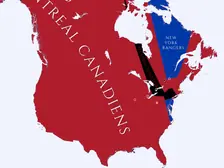
Ended on top: Pittsburgh Pirates
Led the most days: Montreal Canadiens (41 of 97)
Make your own 1927-28 NHL map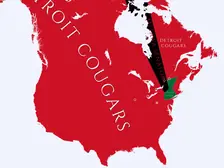
Ended on top: Toronto St. Patricks
Led the most days: Montreal Canadiens (17 of 92)
Make your own 1926-27 NHL map
Ended on top: Boston Bruins
Led the most days: Ottawa Senators (16 of 71)
Make your own 1925-26 NHL map
Ended on top: Ottawa Senators
Led the most days: Montreal Canadiens (15 of 48)
Make your own 1924-25 NHL map
Montreal Canadiens ended on top, led 9 of 28 days
Make your own 1923-24 NHL map
Ended on top: Montreal Canadiens
Led the most days: Ottawa Senators (13 of 26)
Make your own 1922-23 NHL map
Ended on top: Montreal Canadiens
Led the most days: Ottawa Senators (8 of 26)
Make your own 1921-22 NHL map
Ottawa Senators ended on top, led 14 of 28 days
Make your own 1920-21 NHL map
Ended on top: Quebec Bulldogs
Led the most days: Ottawa Senators (15 of 29)
Make your own 1919-20 NHL mapNHL seasons of the 1910s

Montreal Canadiens ended on top, led 14 of 32 days
Make your own 1918-19 NHL map
Ottawa Senators ended on top, led 12 of 32 days
Make your own 1917-18 NHL map

Got ideas for making these maps better? Found something weird? Want to suggest a new feature?